Hi,
I'm experiencing a strange discrepancy between the aaPanel dashboard and my actual system resources. The aaPanel "System Status" widget shows 100% CPU usage, but when I check the processes via htop on the terminal, the usage is significantly lower.
Here are the details from my side:
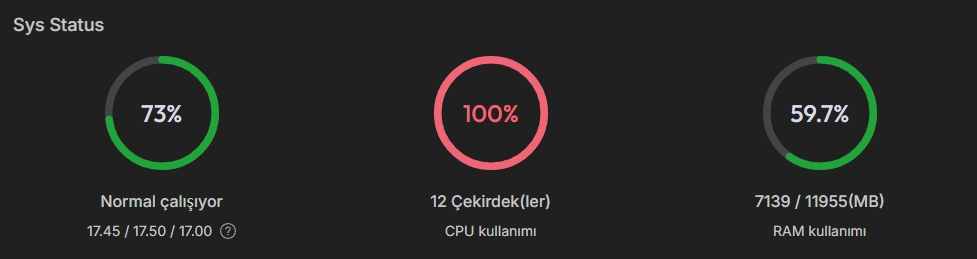
aaPanel Dashboard: Constantly reports 100% CPU.
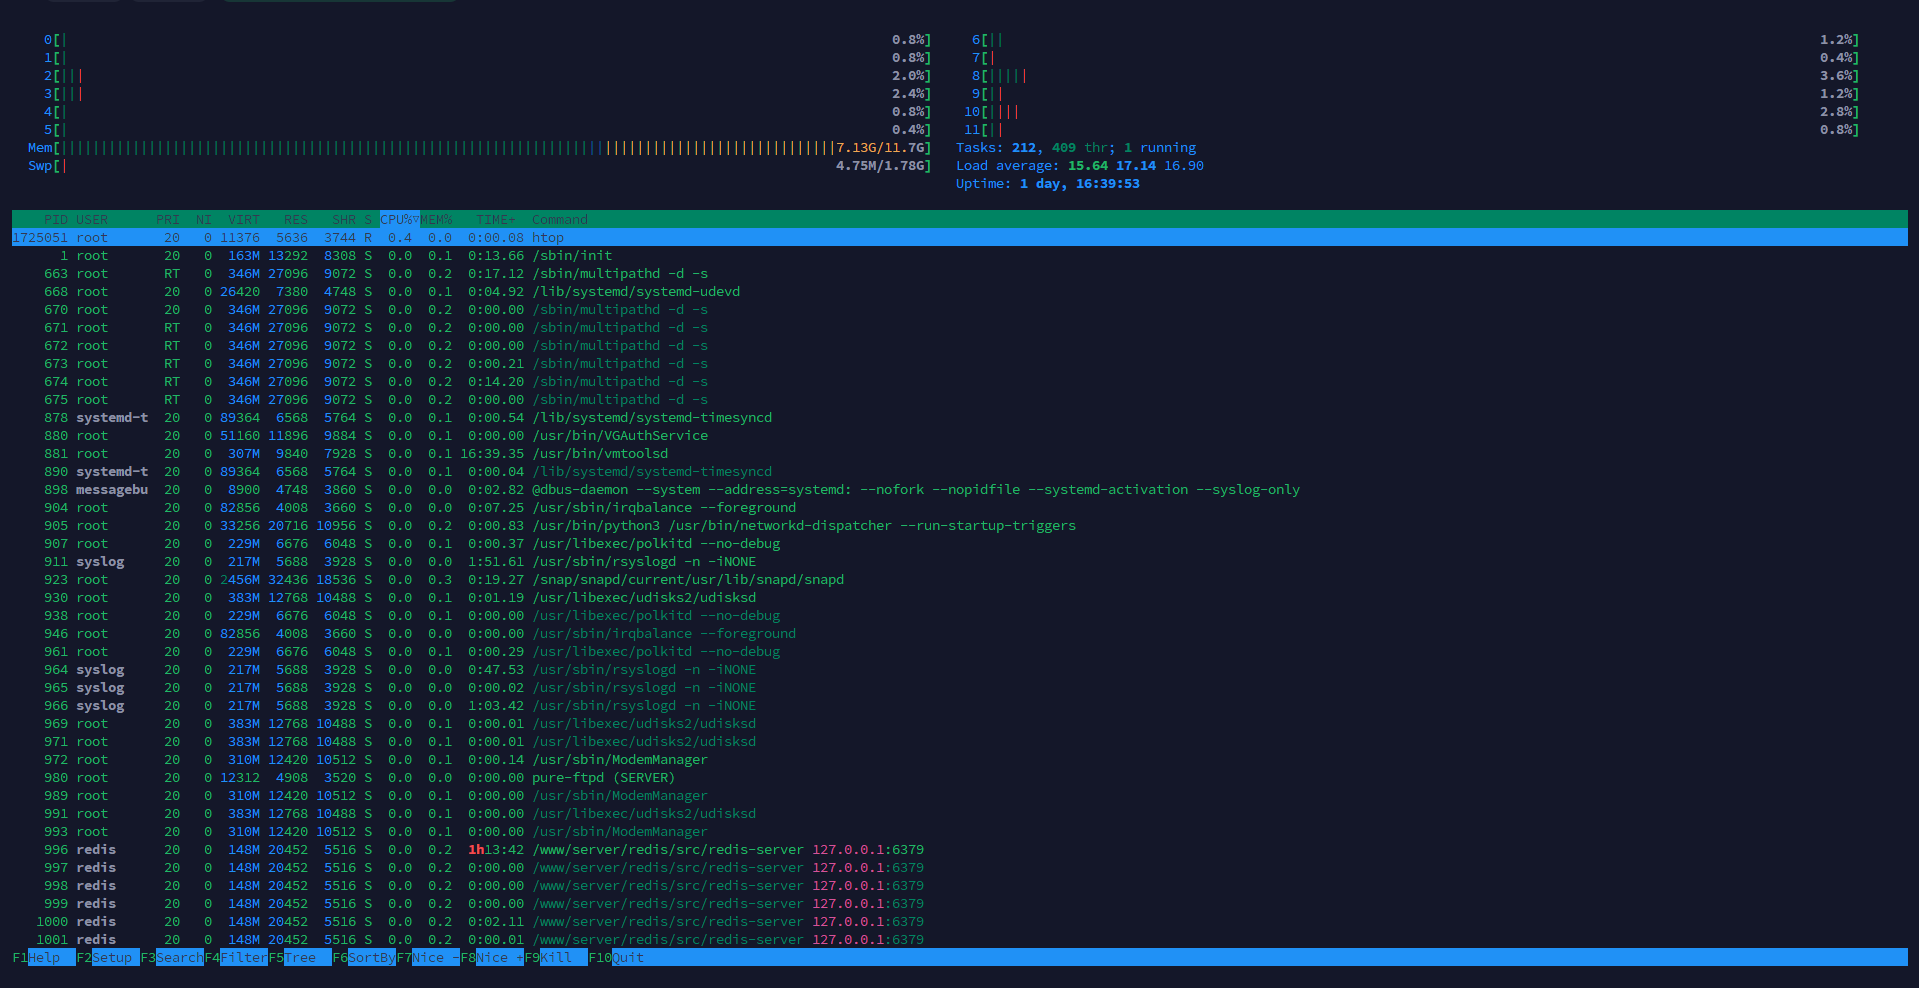
htop output: Individual core usage is low, but I noticed the Load Average is around 15.64, 17.14, 16.90.
Server environment: 12-core system with 12GB RAM.
I have already tried checking the process list, but nothing seems to be consuming the CPU to that extent. Could this be a reporting bug in aaPanel, or is it possible that the high load average is triggering the 100% status?
My knowledge of Linux is limited - in fact, it’s quite limited. So please forgive me if I provide any incorrect information.
I would appreciate any help or suggestions on how to resolve this. Thanks in advance!