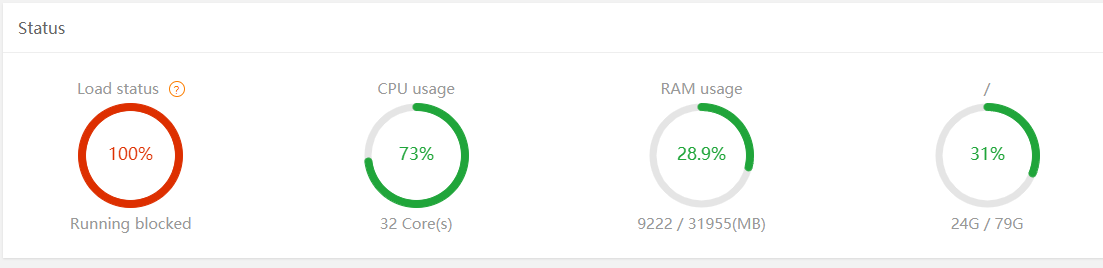
aaP_evelyntanadi89 hello i want to ask how did my load status was 100% ? i already read this https://www.aapanel.com/forum/d/1265-what-does-the-data-in-load-status-represent, but when i double check all my server was fine and 100% optimized (i/o disk isnt problem and the others.). Its wordpress running on php 7.4 with Redis cache + wp fastest cache installed. hosted on dedicated AMD EPYC 32 Core 32GB RAM 80GB NVMe SSD anything i can do for reduce this load status ?
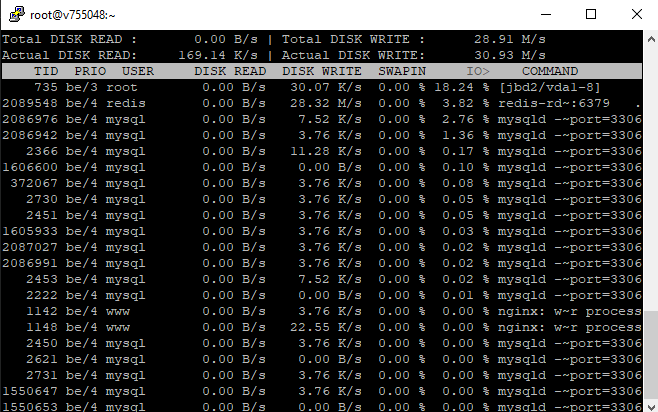
aaPanel_thisyear aaP_evelyntanadi89 Hello, from the server command line, execute the following command to troubleshoot and analyze yum -y install htop && htop yum -y install iotop && iotop
aaP_evelyntanadi89 aaPanel_thisyear its normal already, with same concurrentuser, idk why maybe my site got attacked.