aaPanel_Kern Hello, if you encounter the same BT-Task, please restart aapanel first. We will fix it. nowadays aaP_lil.risk2018
aaPanel_Kern Hello, try clicking the "Fix" repair panel on the homepage interface. Can this problem be solved? aaP_admin470 a6smile aaP_kd_thietbithethao aaP_diaz.zaid20 nowadays
aaPanel_Kern Hello, thank you for your feedback, we will fix it please restart aapanel first. We will fix it. aaP_kd_thietbithethao
aaPanel_Kern Hello, if it is BT-Task, you can restart aapanel first to solve the problem temporarily. We are dealing with this problem. aaP_admin470
aaP_admin470 aaPanel_Kern Yeah, it seems to have fixed the problem. I've been monitoring it for several days after applying the fix, and it hasn't been stuck at 100% again, as far as I can tell.
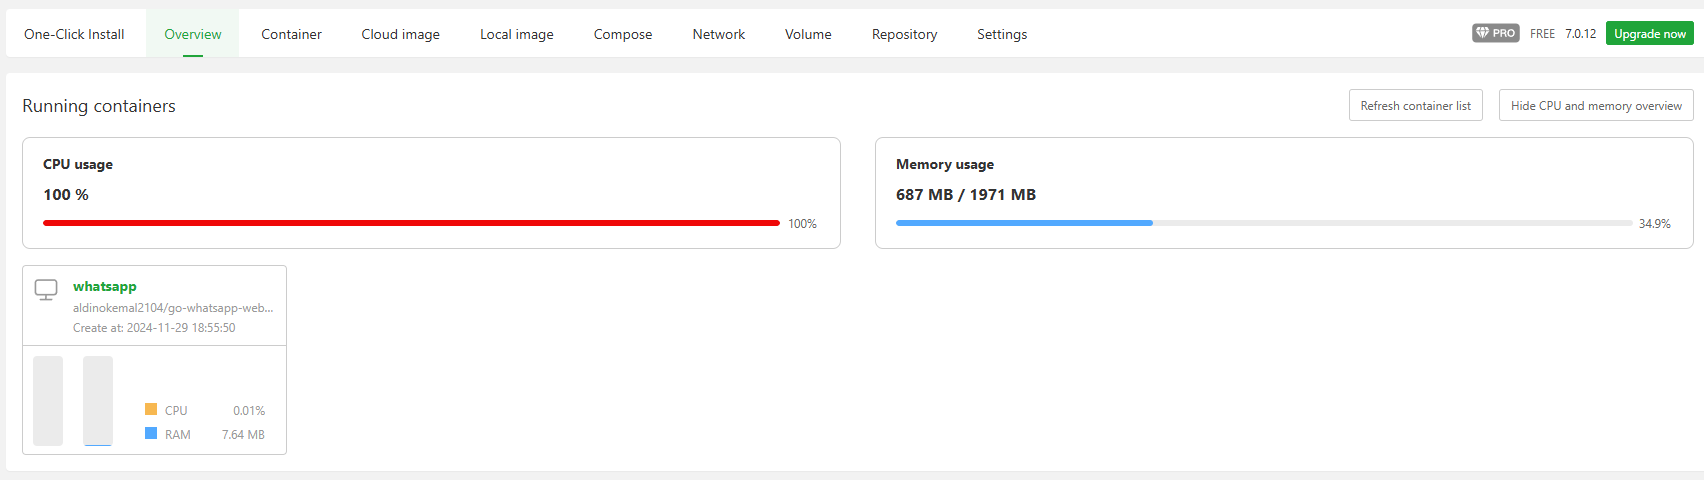
aaP_admin470 aaPanel_Kern Hi, I have this condition again but now not from BT-Task but /usr/bin/dockerd. It strange because not container that causing it, the cpu usage by container is low.
aaP_simonsoft aaP_admin470 is there a fix? cpu use if 358% blocked. my only one domain hosted is crawling due to this BT-Task
aaPanel_Kern Is it possible to try manual update? rm -f /tmp/update_to7.pl && curl -k https://node.aapanel.com/install/update_7.x_en.sh | bash aaP_simonsoft
WTERH Hi, I have the same problem. Did you find a solution? I tried restarting aapanel. I tried rebooting the server. I tried using "fix" on the home page. I tried updating manually. BT-Task still uses 80-99% of the server resources.
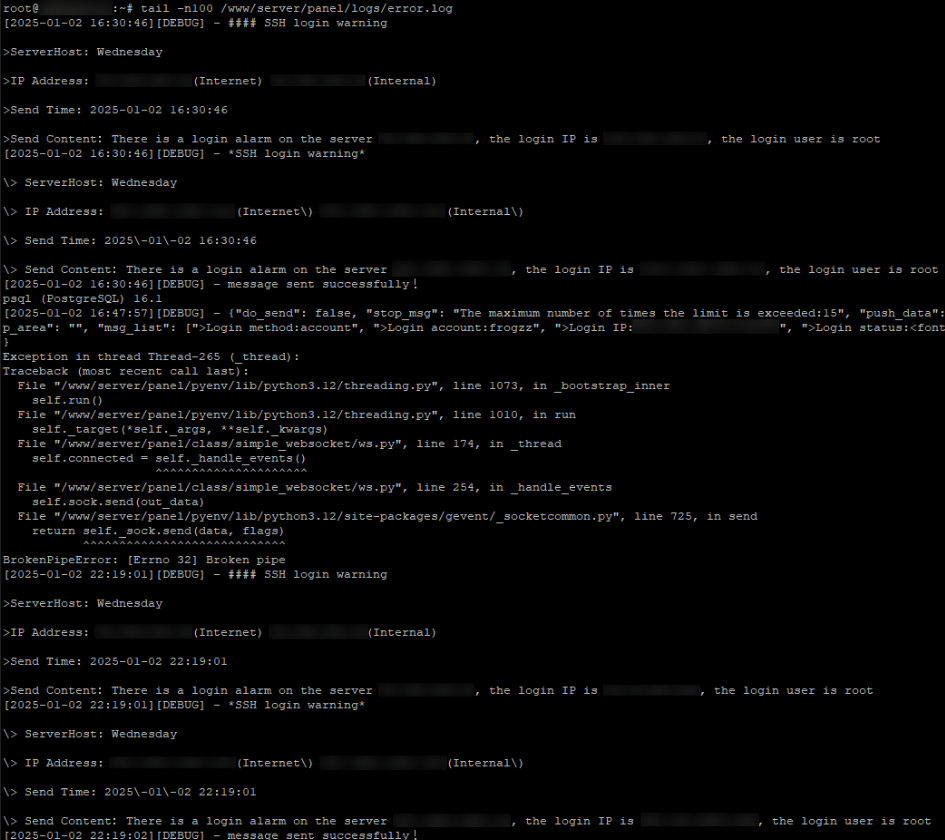
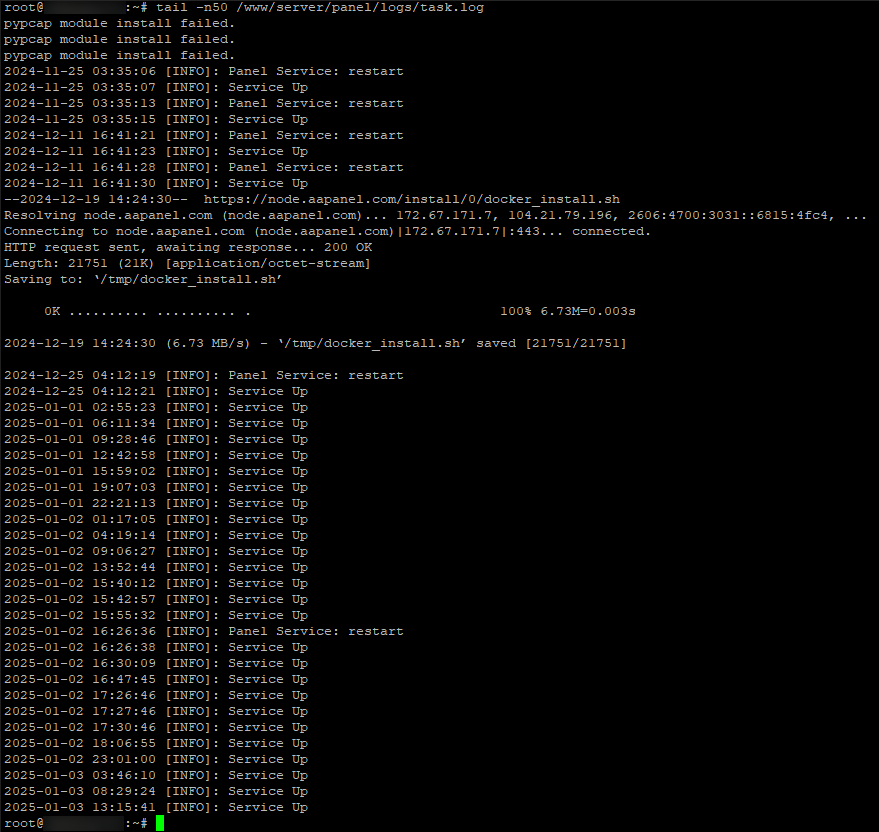
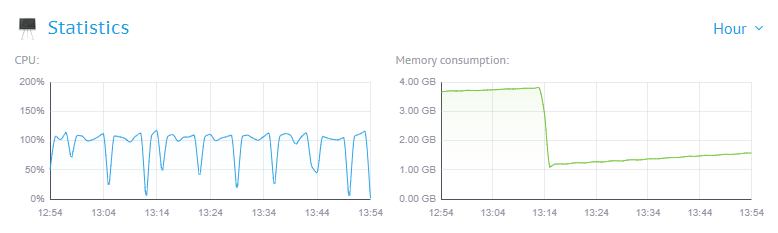
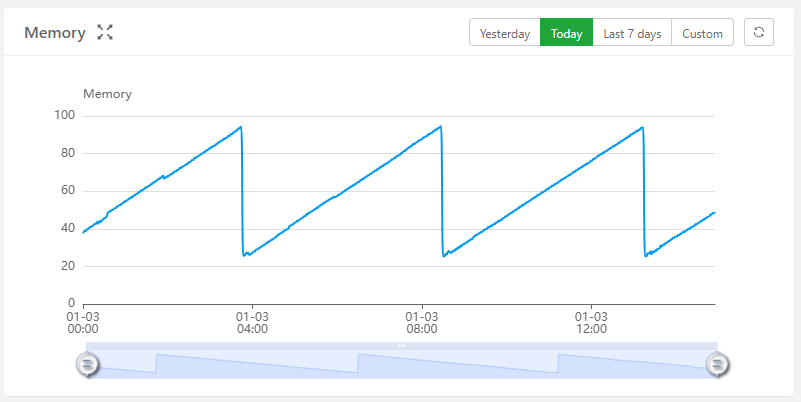
aaPanel_Kern Hello, is the server load normal? Are there any screenshots of the top command? You can also check the logs tail -n20 /www/server/panel/logs/error.log tail -n20 /www/server/panel/logs/task.log WTERH
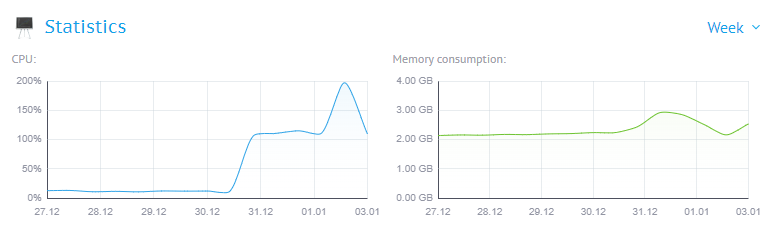
WTERH aaPanel_Kern Hello, abnormal load on the server. This screen from my hosting panel statistics for the week: per hour: I wanted to show the real-time load from "htop", but as luck would have it, I get into a time period when resource utilization has not yet reached its peak. The graph of the monitoring section shows that utilization is formed within 4-5 hours, every 4-5 hours. Monitoring: But monitoring does not see the bt-task in all graphs. If you need more information, tell me what kind, I will provide it. From the last actions with packages from the "App Store" were installed and removed docker-manager and postgres, but after remove postgres, tab in "Database" still work