If you manage Windows servers, you know how much time monitoring can eat up with digging through logs, checking resource graphs, and responding to complaints. You want something that just works without fuss. In 2027, Zabbix is still the go-to choice. It delivers reliable alerts and, once installed, almost disappears into the background. Set up is pretty basic: install the agent on your servers, point them to your central Zabbix box, and within an hour, you’re tracking CPU, memory, disk usage, and service health, all without needing to revisit those servers. Sure, paid tools come with flashier dashboards, but for most small teams, once basic alerting like email or Slack, take your pick is running, you don’t miss the extras. Let’s look at what’s really worth adding to your monitoring setup and what you can comfortably ignore.
Nobody has time for endless configuration or a parade of false alarms. Think about it: when a server’s RAM is running out, or a critical service crashes, often the first sign is a user complaint and not an alert. A good monitoring tool flips that script, warning you before things hit the fan. The tools that stick are the ones that stay out of your way. If your monitoring system needs babysitting every day, it turns into just another maintenance chore people can’t keep up with.

Why Most Admins Still Struggle With Monitoring
One of the big headaches with monitoring is noise. It’s not that there aren’t enough tools but there are more than anyone needs. But a lot of them come with so many alerts you tune them out. If you’re running half a dozen servers, you don’t want to check multiple dashboards every morning. What admins really want is a single place that’s quiet during normal operations and obvious when something is off. And another deal-breaker: monitoring agents that use too many server resources. That’s minimal on a file server, but it’s a pain if you’re also running SQL Server or a bunch of VMs. The best tools minimize their impact so servers can focus on their real work.
What to Monitor First
What should you actually monitor first? Start with the real pain points: CPU, memory, and disk space. These cover most of the typical issues before users even notice something’s wrong. Service status is next if you run Active Directory, DNS, SQL Server, or IIS, keep tabs on those processes. Only add disk performance and network stats if you’ve had issues there in the past. Trying to track everything from day one is a recipe for endless notifications you’ll end up ignoring.
Here’s a sensible starting list:
- CPU usage over 80% for at least five minutes
- Memory drops below 15% available
- Any disk volume under 10% free space
- Key services aren’t running
- Backup failures, if your backup solution supports monitoring
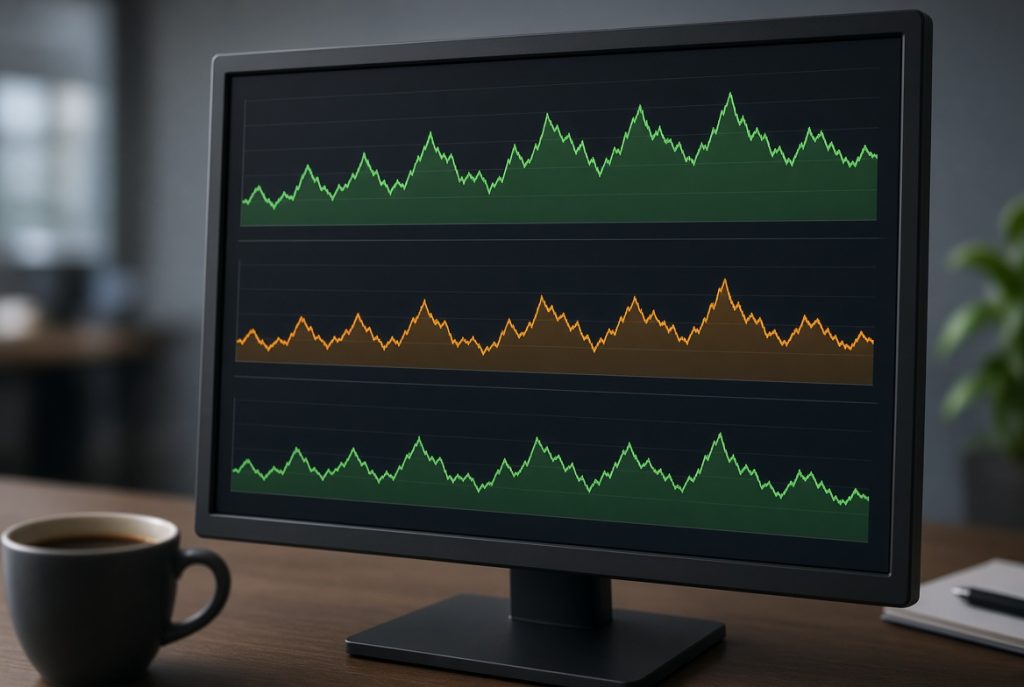
This list alone solves most “Why is everything slow?” questions before they start. Once these run smoothly for a couple of weeks, consider adding more.
Open Source Options and Paid Tools
Open Source Server Monitoring Software is a real contender. The core features are free, and the community’s already nailed down common needs for Windows servers. Zabbix, Prometheus (with Windows exporter), and Checkmk are all solid picks. You might spend a bit more time on the initial setup compared to commercial tools, but after that, the cost is almost nothing. Paid platforms like PRTG or SolarWinds often get you up and running faster, with slicker interfaces and extra reporting .This is handy if you’re responsible for dozens of machines or need to show management some graphs.
When it comes down to it, choose between spending a little more time up front or a little more cash. If you’ve got an afternoon to spare, the open source route gets the job done for most small environments. If you’re in a hurry and budget isn’t tight, go commercial. Either way, what matters most is that the alerts actually reach you and don’t drag down server performance.
Setting Up Alerts That People Will Read
Alert setup is critical. Alerts that trigger all day get ignored. Set your thresholds carefully. It must be high enough to filter out routine spikes, plus a brief delay to avoid noise from short bursts. Only send alerts to the people who’ll fix them. Usually a single Slack channel or email distribution list works better than pinging every admin about every tiny hiccup. Make your alerts clear: include the server name and the specific metric so it’s obvious where to look. No need to log into the monitoring dashboard every time.

Test everything. Don’t just trust the dashboard. Turn off a non-essential service or fill a test drive to make sure notifications actually arrive. It’s easy to think things are working only to discover later that alerts got blocked by firewall rules or dead credentials. A five-minute test in advance saves hours later.
Keeping Monitoring Light Over Time
Keep your monitoring light. Once it’s set up, check it every month or two. Delete pointless checks. Raise thresholds that fire too often. The best systems stay lean and useful for years; bloated setups full of unused checks and old templates become dead weight, just another job to ignore. Track which servers and metrics matter most. You’ll thank yourself (and so will the next admin) when someone new steps in. Service and disk status almost never need tweaking. CPU and memory alerts may need updates as workloads change. Even a quick double-check every few months is enough to keep things running smoothly. You want a system that works silently and only calls out when there’s actually a problem.
In 2027, the mission for Windows Server Monitoring Tools hasn’t changed: catch trouble before users catch you. Zabbix keeps its spot because it’s free, has solid documentation, and doesn’t require hand-holding. Set up the key checks, confirm your alerts, and don’t waste time monitoring every possible metric. A straightforward setup that works beats a fancy system nobody pays attention to. Once the basics are down, those sudden panic moments like disks filling up or services crashing become rare. You get to spend more time on work that actually matters.