Servers rarely go out with a bang, they tend to stumble first. Maybe the disk’s full. Maybe memory’s being swapped. Sometimes it’s just a single cron job stuck in limbo. Usually, you only know something’s wrong when your site drags or a client sends a frustrated message. That’s where open source server monitoring software steps in. These tools catch issues before they spiral into late-night emergencies. You don’t need an expensive, all-in-one enterprise platform for this. What matters? Metrics you trust, alerts you’ll actually pay attention to, and a setup that works on hardware you already own.
This list is for people running VPS boxes, a handful of servers, or home labs that somehow turned into real production. Every tool here is well-used, actively maintained, and ready for real work provided you give it a bit of attention and fine-tune the alerts.
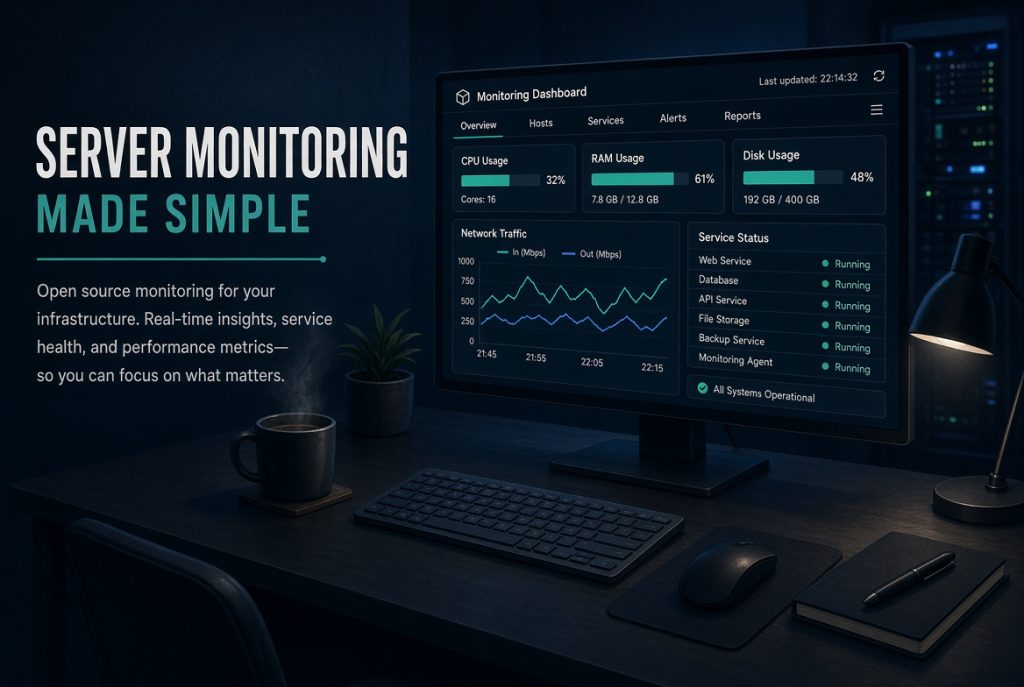
What Monitoring Should Actually Tell You
Pretty CPU graphs are nice, but they only tell part of the story. Good monitoring tracks the core stuff: system load, memory, disk usage (and if the disk is lagging), network hiccups, and most important if the services you rely on are alive and well. For web servers, that means checking Nginx or Apache, your app process, and the backend database. If you’re running a mail or game server, change up the checks but the idea stays the same. Follow the real user path, not just what looks cool on a chart.
Uptime pings? They’re just the beginning. Sure, they’ll say if your port’s open, but they won’t notice if the database is locking up or if overnight backups swallowed the last chunk of disk. Pair those simple checks with deeper resource and log monitoring. When a metric just screams “something’s wrong” but you don’t know what, logs will dig up the clue.
Alerting really makes or breaks your stack. If everything pings you, you’ll end up ignoring it all. If nothing does, you miss the chance to catch problems early. Start with the low-hanging fruit: disk at 85% full, memory that stays maxed, services that trip up a couple times in a row. Get the basics dialed in before you get fancy. One of the best parts of open source is the control so you’re not stuck with generic settings from a hosted tool.
Why People Choose Open Source Server Monitoring Software
Cost is the obvious reason. Licenses start to sting when your server count goes up. But ownership matters just as much. Your data stays on your turf. You decide what gets logged, how much history you keep, and how things look. If something’s broken, you can fix it instead of waiting ages for some new feature. The trade-off? You do a bit more work. Someone has to set things up, open the right ports, keep the databases clean, and manage upgrades. If nobody on your team is ready to do that, a managed service might save you headaches. But if you live on Linux already, open source server monitoring software will probably feel natural.
Remote access matters too. “How To Monitor Server Performance Remotely” isn’t a different product but it means you use a VPN, SSH tunnels, proper UI security, and agents that phone home without leaving your whole network exposed. Don’t just hang Grafana or Zabbix out on port 80 and call it secure.
Top Monitoring Tools that Get the Job Done
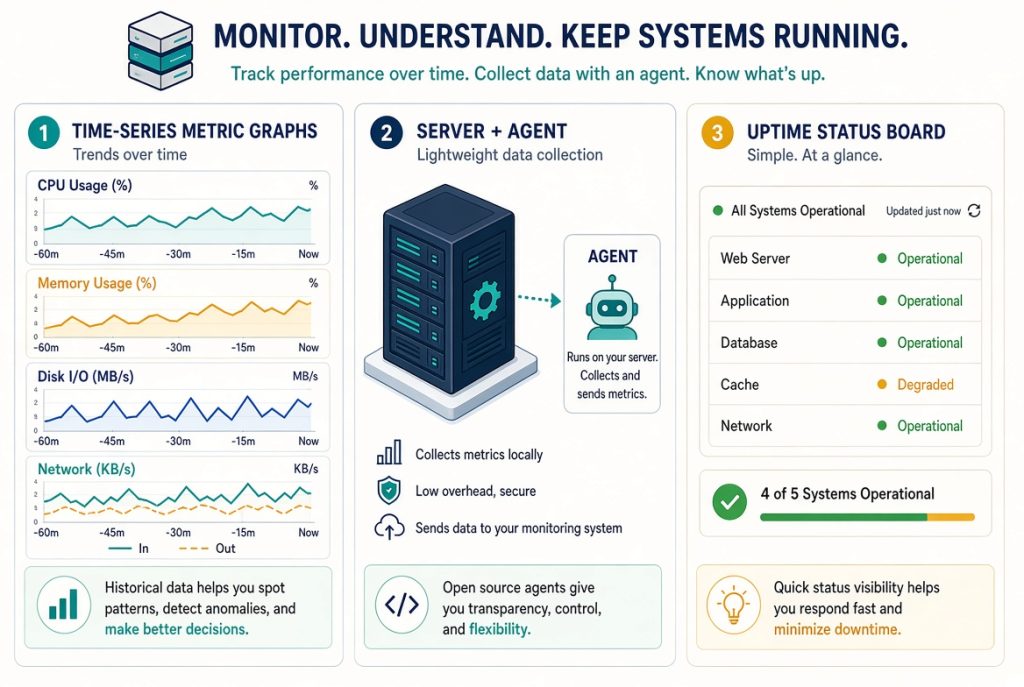
These aren’t random downloads but they’re the ones showing up everywhere in production. And yeah, you can mix and match. Lots of people use Prometheus to collect data, Grafana to actually look at it. Some want an all-in-one box that handles servers, SNMP, and network maps.
Prometheus and Grafana

Prometheus pulls data at regular intervals and stores it in a time series database. Grafana turns that data into dashboards and alerts. Together, they’re the gold standard for modern monitoring and you’ll find an exporter for almost any service you run. The downside? You assemble the stack yourself, and the first weekend might be a bit of a headache as you bolt on exporters and write your own rules. But for cloud-native and classic VPS fleets, this pair is hard to beat
Zabbix
Zabbix feels more like a complete solution: agents, templates, network discovery, alerts, a web UI all out of the box. It can scale to thousands of hosts if you plan your database right. Templates cover loads of standard checks. The UI isn’t as slick as Grafana, but there’s less tinkering behind the scenes. If you want everything in one place like service checks, triggers and inventory Zabbix does the job.
Nagios Core and Icinga
Nagios taught a whole generation about open source server monitoring software. The core system still works well for scheduling plugin checks. Icinga forked off and now offers a friendlier interface and modern APIs. Both stacks work best if your mindset focuses on “is this service healthy?” more than deep metrics. The plugin scene is massive, though some tools show their age.
Netdata

Netdata is what you reach for when you want instant feedback. You’ll get a dense, real-time local dashboard, and per-second metrics spotlight weird spikes. It can stream stats to a central hub or the cloud, showing the big picture if needed. For a single VPS, it’s often the fastest win around. On a big fleet, you’ll still want something for long-term storage and alerting. Think of Netdata like a microscope and pair it with another tool to spot long-term trends.
Checkmk
Checkmk Raw Edition is open source and boasts plenty of auto-discovery magic. It lives in the same ecosystem as Nagios, but with less headache setting up each check. The paid version adds more bells and whistles, so double-check what’s included before betting the house. For mixed environments like servers, network gear, SNMP devices it’s a safe middle ground.
LibreNMS

Born from network monitoring, LibreNMS specializes in switches and routers, but it’ll watch your servers too. It really shines when your bottlenecks are more in network land than inside the VM. Auto-discovery is surprisingly powerful. Just keep an eye on server load as your device list grows.
Uptime Kuma

Not a full monitoring suite, but brilliant for what it does. Rapid self-hosting, clean uptime checks (HTTP, TCP, ping), and a public status page all in minutes. Pair it with a metrics system for real coverage. If you need a quick “is the site up?” dashboard, it fits nicely.
Think about what matters most at 2 a.m. That moment when you’re troubleshooting. If it’s “what ate up all the disk space,” you want metrics with some history. If it’s “is checkout down,” service checks and clear alerts take priority.
How To Set Up Open Source Server Monitoring Software
Don’t try to monitor everything at once. Pick one critical server. Install an AI agent or exporter. Track CPU, RAM, disk, and your most important app process. Run it for a week. Add some real alerts. Then move to the next server. Massive, all-at-once rollouts just lead to dashboards nobody reads.
Store your monitoring data somewhere safe, not on the same disk as your production DB. If monitoring shares a fate with what it watches, that’s just…bad luck waiting to happen. Think of it like Backup and Restoration Strategies: you haven’t really got a copy until you’ve restored it, and you haven’t really set an alert until you’ve tested it. Trigger a fake warning now and then. Make sure the right person gets the message.
Lock down your dashboards. Unique passwords, two-factor authentication where you can, never leave admin ports wide open. Let your server agents send data in. Don’t broadcast all your metrics to the world.
Focus on a handful of dashboards like “web health” and “database essentials” beat dozens of abandoned panels from a late-night tutorial binge.
Mistakes Too Avoid
- Hoarding every metric forever fills up disks. Set some retention policies. Ignore noisy, pointless metrics. Don’t trigger an alert every time CPU tickles 80 percent for a moment because people start tuning those out. Focus alerts on real, ongoing problems and anything that hits users.
- Another common slip is only monitoring the hypervisor, not the VMs (or vice versa), or watching just the servers and forgetting the switches. Every gap hides a potential outage. Follow the full path.
- Don’t treat open source server monitoring software as a “set it and forget it” job. Versions change. Exporters break after routine system upgrades. Set aside time each month to scan and update. Just as you would for the rest of your patches.
- If your single Prometheus instance can’t keep up, add remote write storage or split things up before it grinds to a halt. If your Zabbix install bogs down, clean up the database before adding more hosts. Plan capacity for your monitoring gear as surely as you do for production.
Choosing a Stack You’ll Still Use Next Year
For most Linux fleets, Prometheus, Grafana, and a handful of exporters are the current go-to combo. Bolt on Uptime Kuma if you want a public status board. Use Netdata when hands-on troubleshooting demands real-time detail.
Zabbix or Checkmk feel more complete for mixed environments like Windows hosts, SNMP gear, network mapping. Icinga is the modern take on classic Nagios situations. LibreNMS if your business really is the network.
The best open source server monitoring software? It’s the one you’ll actually check on a quiet Tuesday and not just during a crisis. Start small. Only alert on what matters. Keep enough history to troubleshoot, but don’t hoard forever. Watch the services that keep the business running. Popularity lists get you started, but your actual outage logs are the best proof you picked well. If you can, install your monitoring stack on a dedicated VM. Keep configs in git. Review alerts every quarter and kill the ones nobody uses. Quiet, trustworthy monitoring is worth way more than a sea of unused charts. That’s why these tools stay near the top for every admin who just wants their servers to work, with a little less drama.