If you’re in charge of websites, apps, or any kind of online service, you know the anxiety of not knowing what’s happening with your servers. Remote server monitoring lets you keep tabs on everything, no matter where you are. The truth is, you almost never sit next to the machines you manage. For system admins, developers, and business owners, remote monitoring is just how the world works now.
Servers demand constant attention. High CPU loads creep up, memory leaks happen at the worst moments, disk space dwindles without warning, and traffic spikes never seem to come at a convenient time. Spotting these issues early makes all the difference. Catch a problem before users see it, and you prevent complaints, downtime, and a lot of panic. With cloud hosting and distributed teams, you have to monitor from everywhere, all the time. It’s not just a best practice, it’s survival.
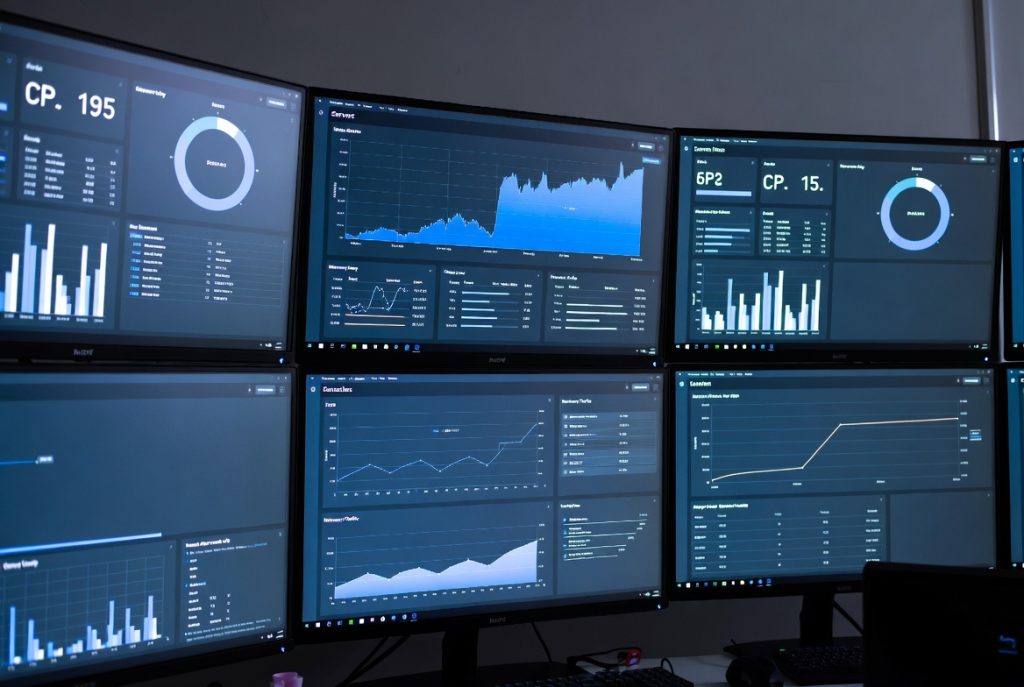
Remote Monitoring: Why Bother and What Actually Matters
Getting real-time info on your servers means you don’t have to wait for that message “Is your site down?” email. You see what’s coming and handle it before it gets painful. It doesn’t matter if you’re responsible for a single VPS or a bunch of cloud services, remote access to resource data is essential.
But don’t just track everything. The key is to focus on the numbers that really tell you what’s happening. CPU usage shows if you’re pushing your hardware too hard. Memory lets you know if you’re about to hit a wall. Disk space and disk I/O highlight storage strain. Suspicious network traffic spikes might signal you’re trending or under attack. Load average gives you the bigger picture.
Don’t forget uptime and response time. If something goes down, you want to know now, not after someone else notices. Blend these metrics together, and you actually understand your server’s health. Make these your anchors when you set up monitor server performance remotely
Picking Tools and Getting Started
There are plenty of ways to start. Maybe you use simple utilities and panel features, or maybe you’re ready for dedicated tools with dashboards, alerts, and trend tracking. Tailor your choices to what you’re running and what you actually need. If you’re running a side project, light and simple works. If you’re managing dozens of servers, you want tools that can handle serious data without drowning you in noise.
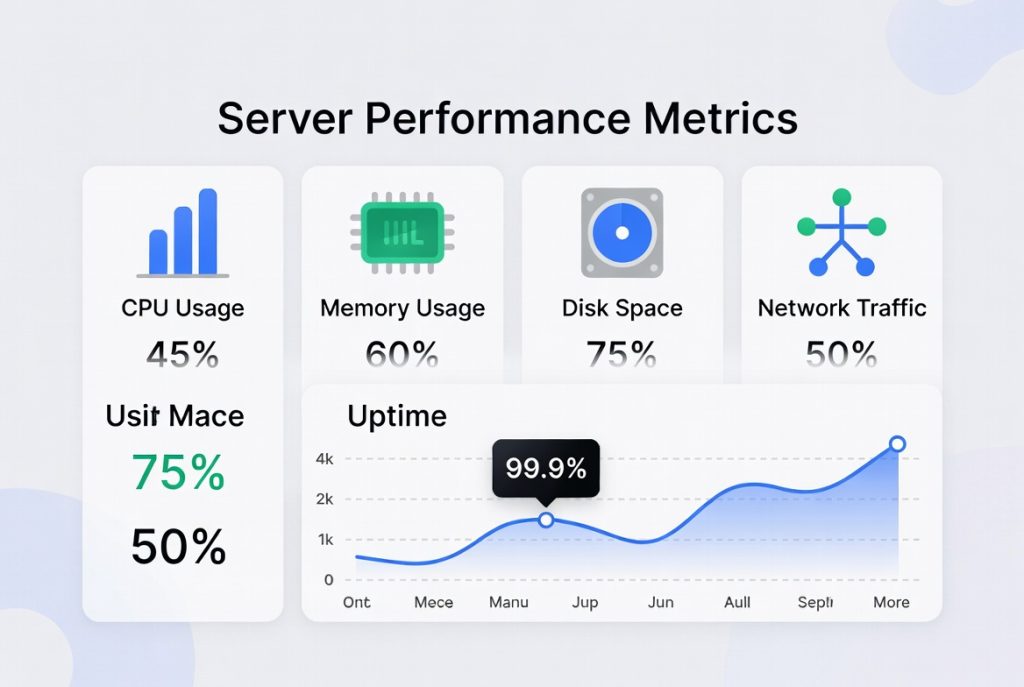
You’ll find all sorts of Server Monitoring Tools: some fast and simple, others loaded with analytics. Choose ones with mobile apps or web-based dashboards because you don’t want to be chained to a desk. Integration with chat tools means you get immediate alerts wherever you happen to be.
Secure your access first. SSH is the go-to for Linux systems. Once you’ve got access, set up your monitoring. Define what counts as “high” CPU or a dangerous level of free disk space. Tailor your alerts so you only get nudged when it matters.
Check reports regularly, daily or weekly. You’ll spot trends that don’t trigger instant alarms, but point to problems down the line. Historical metrics make it easier to plan hardware upgrades and troubleshoot repeating headaches. But don’t let monitoring itself slow things down and pick tools that give you just the facts you need.
Recommended Tools to Monitor Server Performance Remotely
- Prometheus: A strong open-source option that collects detailed metrics and works well with visualization tools like Grafana, giving you flexible dashboards and powerful querying.
- Zabbix: Offers comprehensive monitoring with customizable alerts and supports both small and large environments, making it suitable for administrators who need deeper control.
- Nagios: A trusted choice for network and server monitoring, especially when you want solid alerting and a long track record of stability.
- Netdata: Provides real-time, lightweight monitoring with an easy-to-read interface that requires minimal configuration.
- UptimeRobot: Useful for basic uptime checks and quick notifications when a service goes offline.
Choosing the right tool depends on your technical experience, the size of your infrastructure, and how detailed you need the data to be. Many admins combine a few of these solutions to cover both deep performance metrics and simple monitoring.
Best Practices for Reliable and Secure Monitoring
Look at your dashboards often. Don’t fall into the trap of ignoring alerts, they’re worthless if you do. Keep your tools updated, and document what you’re tracking and why. That way, if you step away, someone else can jump in without confusion.
Too many alerts, though, and you’ll start tuning them out. Fine-tune your settings so the important messages stand out. Make sure you’re watching all your critical services, not just the obvious ones, and keep an eye out for any network issues that might cut your monitoring off from the server. Many teams set up backup notification channels just in case something fails.
Don’t lack on security. Since monitoring typically needs extra privileges, use tough passwords and grant as little access as possible. Check access logs now and then, and stay alert to anything weird. Aim for meaningful metrics, not just an endless scroll of data.
Check out Best Practices in Server Security: Protect Your Digital Assets for more tips about this topic.
Final Thoughts
Remote server monitoring isn’t just about tech but it’s sanity insurance. Track what’s vital, set up alerts you’ll actually respond to, and make a habit of reviewing and improving your setup. You’ll dodge most disasters before they become real problems.

It doesn’t matter if you’re hosting a hobby site or running business-critical infrastructure. Being able to check server health from wherever you are just feels good. Build your routine and update it as your needs change. Better uptime, less stress, and happier users are the rewards. The goal isn’t total perfection but it’s running things well, one day at a time.