Network monitoring vs server monitoring, most beginners don’t even think about the difference. They see a bunch of green lights and assume everything’s fine, until one day, their site’s dead but the dashboard still says “all good.” The thing is, network monitoring just asks, “Can people get to this server?” is the IP reachable, is port 443 open, is the path slow but alive. Server monitoring, though, wants to know what’s happening on the box itself: CPU burning up, RAM running low, disk filling up, a crashed web process, or broken services, even if your host still pings back like nothing’s wrong. If you’ve got a website, or especially if you let clients log in to your VPS, you need both. Don’t drown in graphs, charts at the start and just cover the basics.
A ping will stay green while Nginx is dead. Your network might look perfect while the disk silently fills up. Pick a small set of checks that matter for your little Linux box. Ignore shiny enterprise suites that you’ll never actually look at.
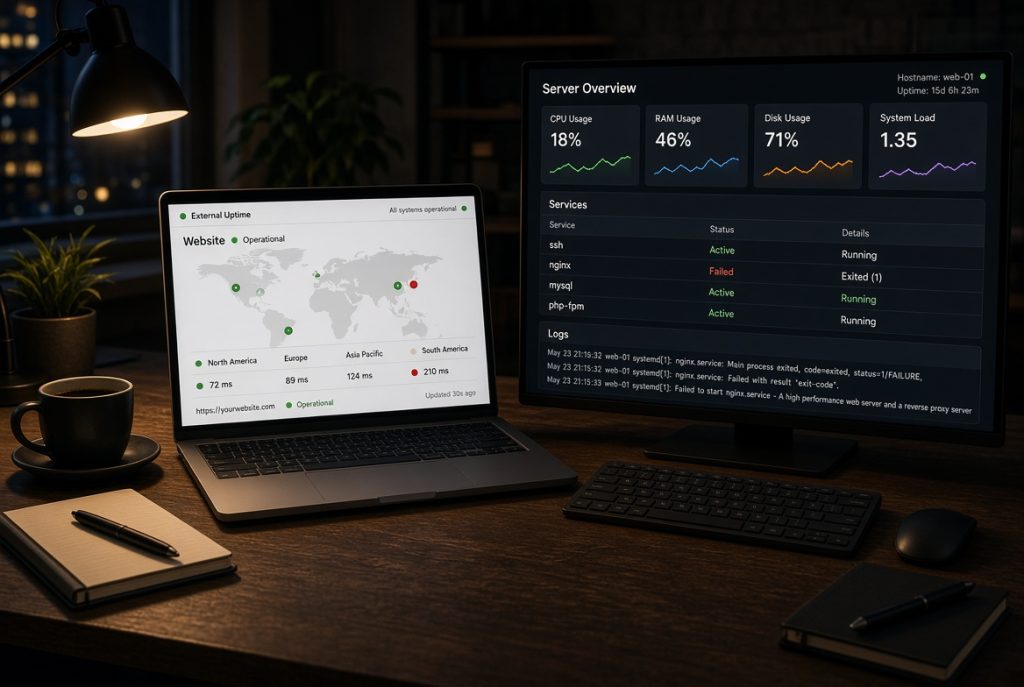
Here’s what these two really watch
Network checks come from outside. Their job is to hit your public IP, domain, or specific ports from somewhere else. If they fail, users in that area can’t reach you either. A homepage that gives a 200 is way better than just a ping, because a ping just means your box replies to ICMP, which doesn’t mean the site works. Lots of places block ping but still serve sites just fine.
Server checks usually run on the server, or from a small agent installed there. These check things like load, memory use, disk space, inodes, and whether systemd thinks nginx, mysql, or ssh are running as expected. They catch the sneaky stuff, too: logs that grew overnight, backups that didn’t finish, swap memory getting hammered even though the network’s fine. If you only check from the outside, your customers will catch your outages instead of you. If you only check from the inside, you’ll miss when some user out there can’t even reach the box, even if your SSH session looks perfect.
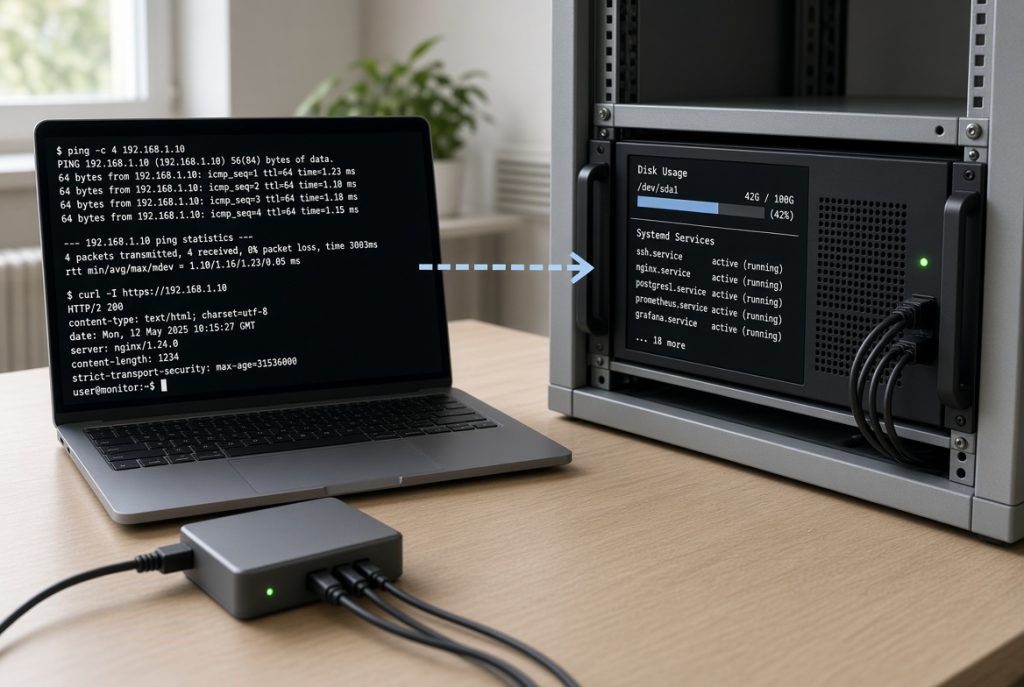
This isn’t a battle of network monitoring vs server monitoring but they’re just looking at different things. One checks the roads to your site. The other checks the engine. There’s no point restarting nginx if your port is blocked, and opening a port does nothing if your disk’s full.
So, why do beginners get this mixed up?
People usually think “the server is up” means one thing. Actually, it means three: the machine is on, the service answers, and a random user can actually load the page. Your CPU chugging along at 20% doesn’t mean your SSL cert renewed, or port 443 is open, or your database said yes to a request.
Then there’s alert spam. A probe failing every minute from one spot flips out, and you’ll mute it and then miss the real problem. Good monitoring means a short list of alerts you’d actually wake up for: disk getting full, a critical service dying, your public URL going down from two different places, and SSH still works so you can do something about it.
Let’s talk uptime checks for a second
Let’s talk uptime checks for a second. Those little badges? They’re just fancy network checks. They’re handy, but they don’t see what’s really happening inside your box. Your homepage could give a 200 even with a cached error and users screaming. Always pair outside checks with at least one trusted inside check. If both look fine and people still complain, believe the people and check the logs.
What do you actually watch on a small Linux box?
What do you actually watch on a small Linux box? Hands down, you need these:
- Disk space and inodes, because a full drive means nothing saves and rebooting won’t help.
- Memory and swap, because a slow leak can go unnoticed until the system suddenly kills a process.
- Failed systemd services, a basic HTTP check, and SSL certificate expiry.
- SSH from outside (not just from the VPS), plus make sure there’s a backup file newer than yesterday.
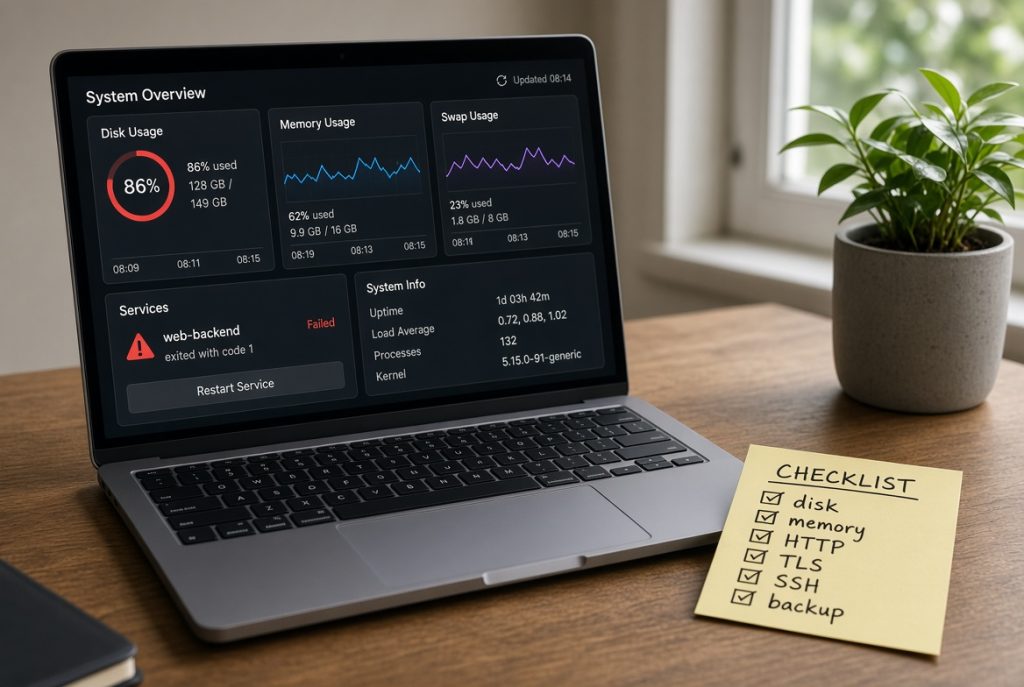
A self hosted control panel can show most of these, and that’s convenient if you live in it anyway for sites and SSL. Just remember it won’t help if the box dies, because it dies too. Always have at least one check that runs somewhere else.
When you’re ready to set up alerts, use this cheat sheet:
| Check            | Type    | Finds                       | Misses                        | Alert when                 |
| ---------------- | ------- | --------------------------- | ----------------------------- | -------------------------- |
| Ping or TCP port | Network | Host or port dead           | App crashed on an open port   | Down from 2 probes         |
| HTTP status      | Network | Site or TLS failure         | Sluggish app still giving 200 | Not 200, or cert <14 days  |
| Disk and inodes  | Server  | Full drive, big logs        | Network/routing problems      | Over 85%                   |
| RAM and swap     | Server  | Memory leaks, too-small VPS | Firewall problems             | Swap rising, OOM showing   |
| Failed services  | Server  | Nginx, MySQL, SSH down      | User can’t reach box          | Anything you rely on stops |
You get the idea: network checks fail publicly right away; server checks usually fail quietly, then go public when things get worse.
If you just want to watch one or two servers, start simple
If you just want to watch one or two servers, start simple. A hosted uptime checker gets you easy network checks. If you want self-hosted, Uptime Kuma is actually doable (and you don’t need five PhDs to install it). It checks URLs, ports, and can ping your phone, Discord, or email. Important: run it on a different machine, because if you’re checking yourself from yourself, you’ll miss everything.
For server stats and graphs, try Netdata. Prometheus and Grafana are for bigger setups (unless you’re already familiar). Glances or a weekly “df -h” help you figure out what an alert meant but they don’t send alerts. Zabbix and Nagios? They’re more of a project by themselves. If you just have one Ubuntu VPS, that’s overkill.
Monitor Server Performance Remotely, you can collect metrics on a separate host, or have an external panel read them. Local graphs show you what’s happening while you’re logged in, but they’re useless if the box goes offline. For most beginners with just one VPS, a second probe somewhere else beats any expensive suite.
So, what should actually alert you?
So, what should actually alert you? Keep it tight:
- Public URL goes down.
- Disk space over 85%.
- Critical service fails.
- (Maybe) TLS expires in 14 days, if you renew by hand.
Don’t add memory alerts until you’ve seen a real leak. For each alert, scribble down the next action. High disk? Check /var/log and backups first, then think about resizing. URL down? Try SSH. Once you know you can log in, see what nginx is doing. Test these rules at least once. Don’t rely on magic you never actually watched work. Use “quiet hours” for things like latency, but never for site down or disk full.
When is one side enough?
When is one side enough? If it’s just a scratch VPS and you have hands-on habits, SSH might be all you need. Both network and server monitoring earn their place the first time someone else is watching uptime (even if it’s just pointing a domain at your box). Ten dashboards mean nothing if you never test your backups. Do yourself a favor: once a month, restore a backup somewhere else and open a file just so you know you can if you need to.
A ten minute weekly habit
Really, you can do the whole routine in ten minutes a week. Check your external probe for weird downtime. On the server, run through disk, memory, failed units, and make sure your backups are recent. Glance at the SSH logs for odd logins. Jot down any changes.
Keep the job simple: network monitoring tells you if users can reach the site. Server monitoring tells you if the box can actually do its job. Watch both, keep your alert list short, and after a while, problems get boring. And that’s exactly what you want.