
Home
aaPanel Home page, the first page after logging in.
On the Home page, you can view server information, CPU, Memory, Disk space size, Network, Hard disk status, as well as the number of websites and databases.
📹 Home Page Video Tutorial
Left menu
Click to enter the corresponding function.
| Home | Website | WP Toolkit | FTP | Databases | Docker | Monitor |
|---|---|---|---|---|---|---|
| Security | WAF | Mail Server | Files | Logs | Node | Domains |
| Account | Terminal | Cron | App Store | Settings |
Home overview
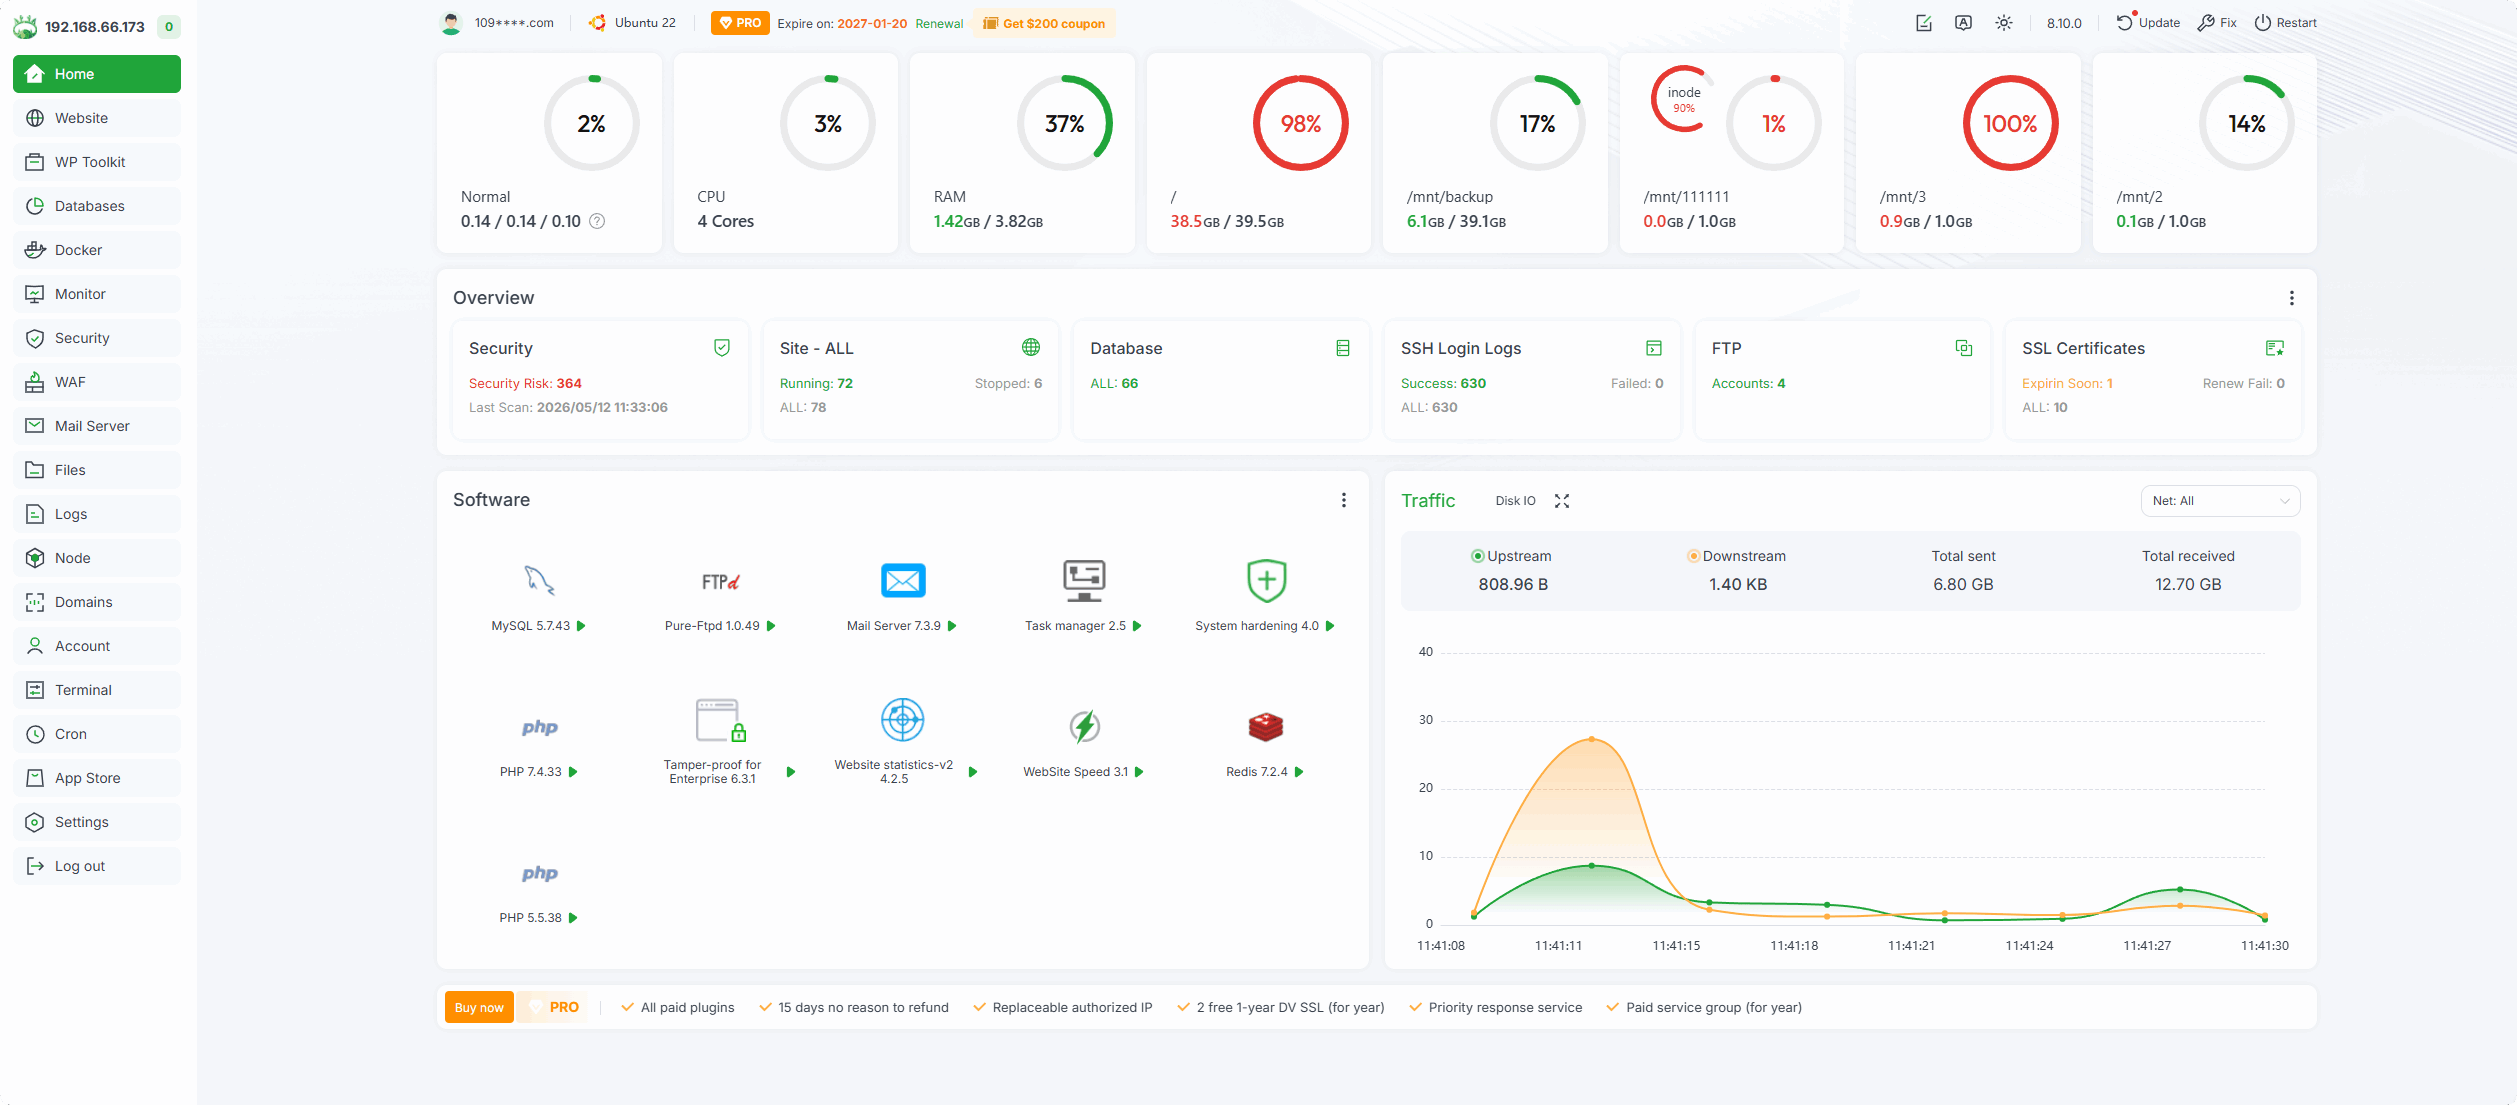
109****.com : Displays the account logged into aaPanel. If need to change or unbind, can go to the Settings.
Ubuntu 22 : Displays the
operating system versionandCPU architectureof the current server and thePython version used by aaPanel.Feedback : If you would like to make
suggestions, you can submit feedback here.
Expire on: 2027-01-20 : Displays the
expiration timeof the current license of the current aaPanel account.Renewal :
Renewbutton, click to renew orVoucher,License.8.10.0 : Display the current
aaPanel version.Language :
Switch languagebutton, click to switch to other languages.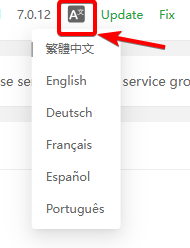
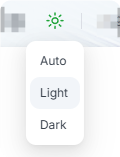
Dark Mode: Switch between Auto and Light and Dark mode.
Update : Update button, click to update aaPanel,
switchtobetaversion orstableversion.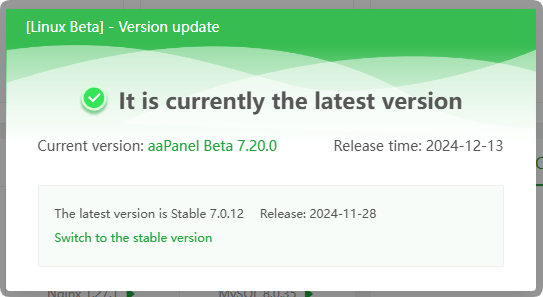
Fix : Repair button, click to
repair aaPanel.Restart : Restart button, click to
restart aaPanelorrestart operating system.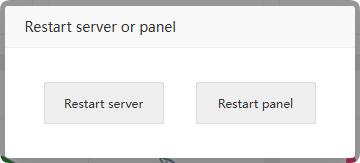
Sys Status
Load status
Place the
cursoron theiconto automatically display theCPU Load Average status.More monitoring information can be viewed at Monitor
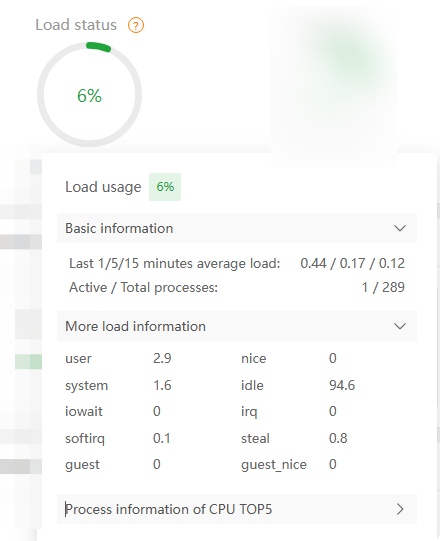
Click
Process information of CPU TOP5: Display CPU TOP5 process information.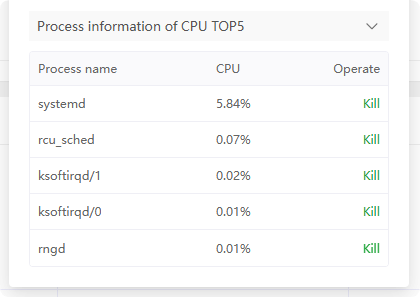
CPU usage
Place the
cursoron theiconto automatically displayCPU usage.More monitoring information can be viewed at Monitor
 Click
Click Process information of CPU TOP5: Display CPU TOP5 process information.RAM usage
Place the
cursoron theiconto automatically displayRAM usage.More monitoring information can be viewed at Monitor
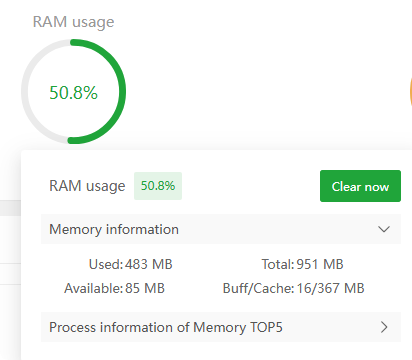
Click
Process information of Memory TOP5: Display memory TOP5 process information.Disk usage
Place the
cursoron the icon to automatically displayDisk usage` information.More monitoring information can be viewed at Monitor
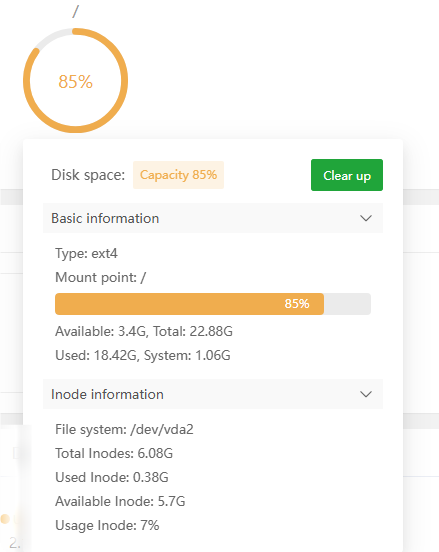
Click
Clear upto use theDisk analysistool to clean the hard drive.
Overview

Site : Displays the number of current
websites, click to enter Website management.FTP : Displays the current
FTPnumber, click to enter FTP management.DB : Displays the current number of
databases. Click to enter Databases management.
Security
Displays the number of unprocessed Security risks of the current operating system. Click to enter for management.
Security Overview
 Check the current security risk items of the server. If there is a security risk, please deal with it in time.
Security Risks
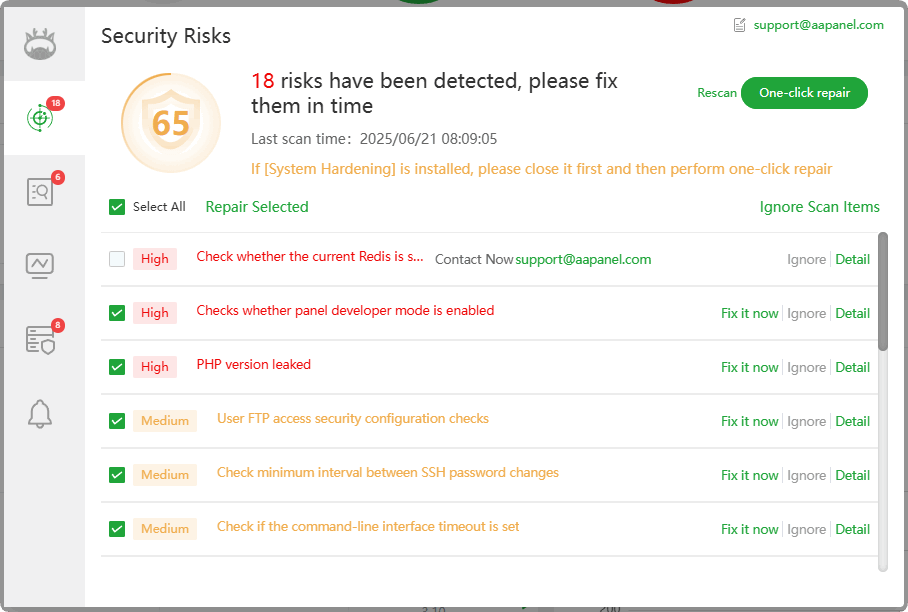
One-click repair : Some security risks can be
repaired in one click, while some security risks only support manual repair.Fix it now: Click to perform
automatic repair, only for some security risks.Detail: View the details of security risks. Since each security risk is different, please make
repairsaccording to theDetails.Ignore Scan Items :
Ignorethis security risk,
Malicious file detection
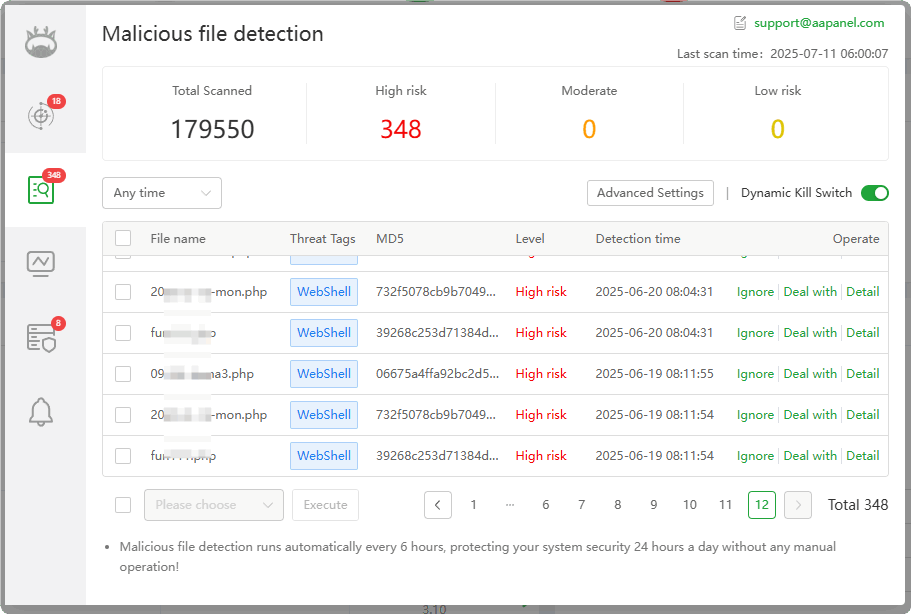 After opening, malicious files in the site directory will be automatically detected. If there are malicious files, they will be automatically moved to the Recycle bin.
Website vulnerability detection
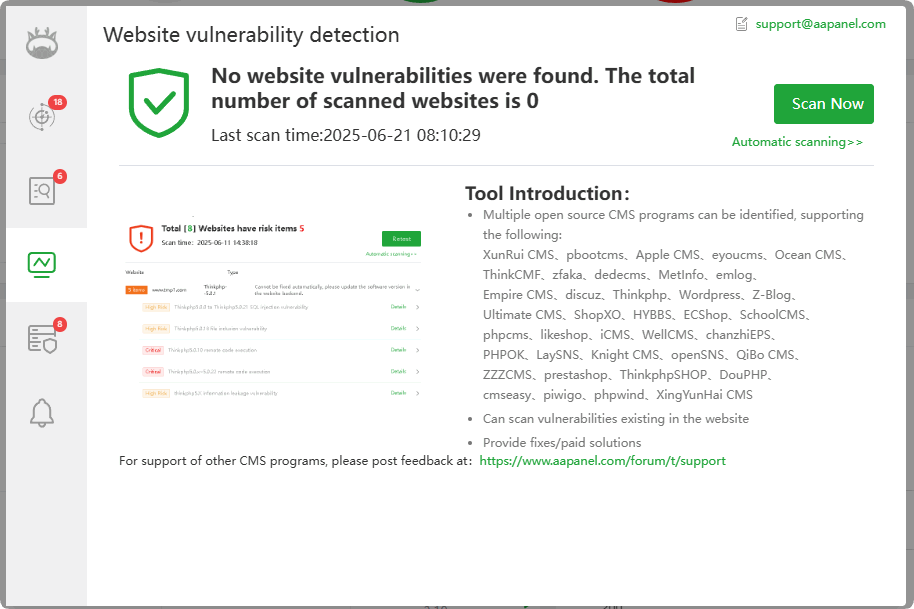 Support mainstream website vulnerability detection
Server security detection
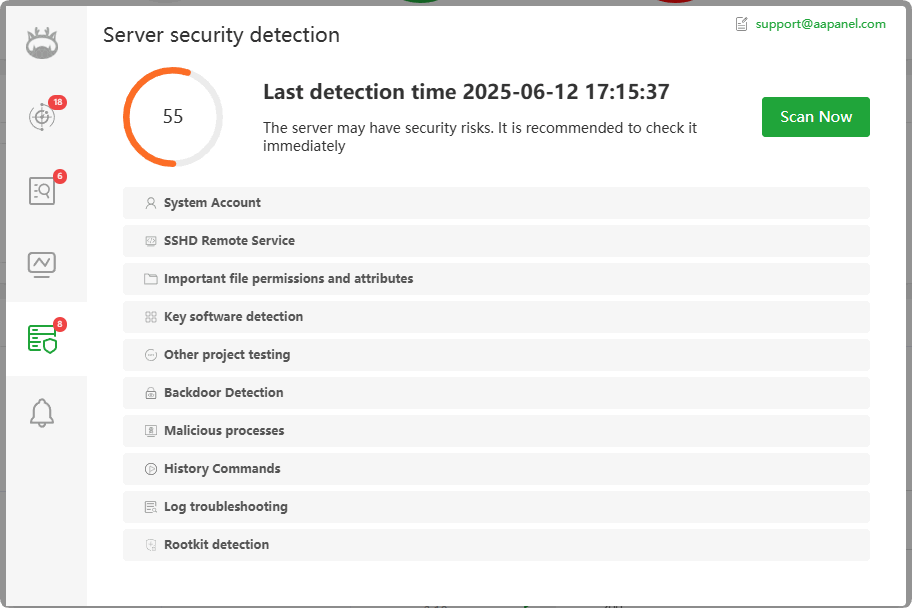 Supports multiple items server security detection:
System Account
SSHD Remote Service
Important file permissions and attributes
Key software detection
Other project testing
Backdoor Detection
Malicious processes
History Commands
Log troubleshooting
Rootkit detection
Global Alarm Settings
Supports
Malicious file detectionNotification when malicious file is detected.
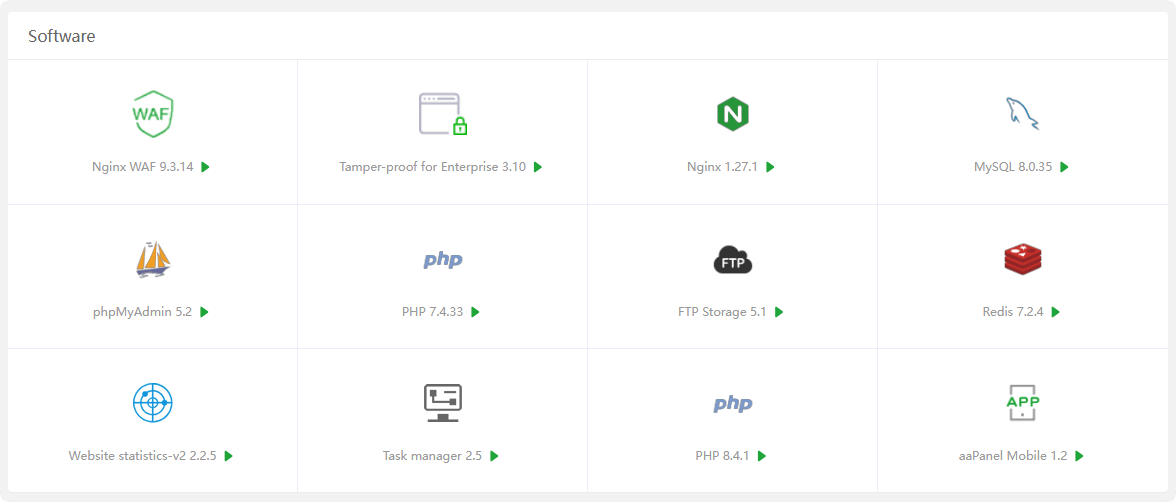
Software
Display is turn on from Settings in the App Store
Display on dashboardPlug-ins/softwareClick to enter the management page of the corresponding plug-in or software.
Traffic
Displays the
real-time trafficof the server network card.
More monitoring information can be found at Monitor
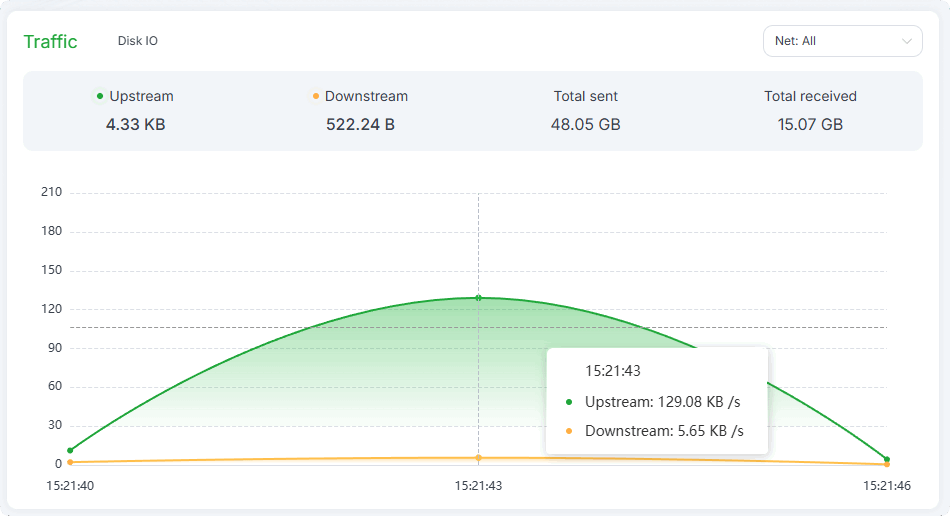
Upstream : Real-time
upstream trafficof the server.Downstream : Real-time
downstream trafficof the server.Total sent : The total traffic sent by the server since the last restart.
Total received : The total traffic the server has received since the last restart.
Net: All : Click to select the
specified networkcard to view real-time traffic.
Disk IO
Display the
real-time hard disk IOinformation of the server.
More monitoring information can be found at Monitor
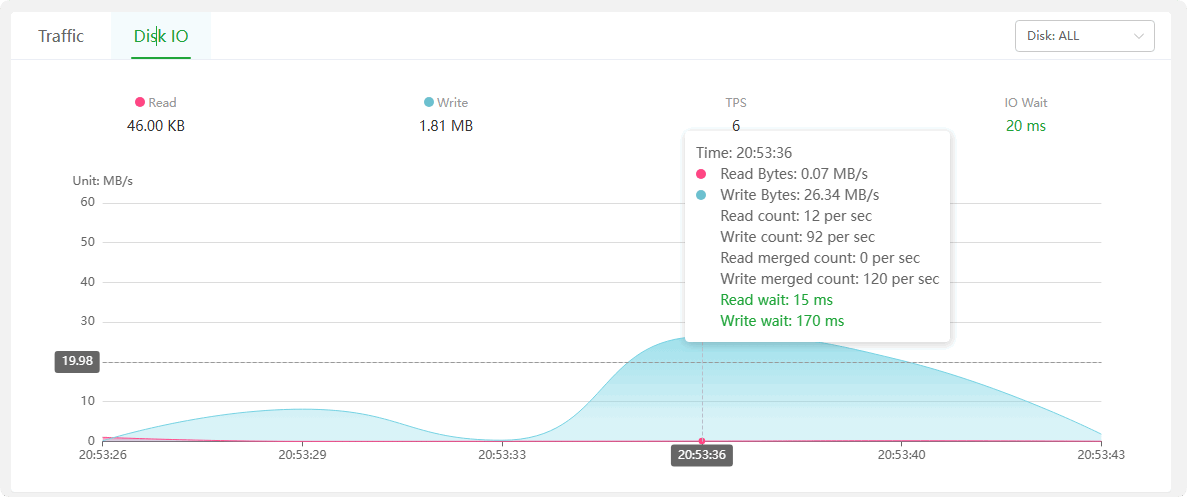
Read : Displays the
real-time reading speedof the hard disk.Write : Displays the
real-time writing speedof the hard disk.TPS : Displays the
real-time write countof the hard disk.IO Wait : Displays the
real-time waiting timeof the hard disk.Disk: ALL : Select a
specified harddrive to view real-time information.
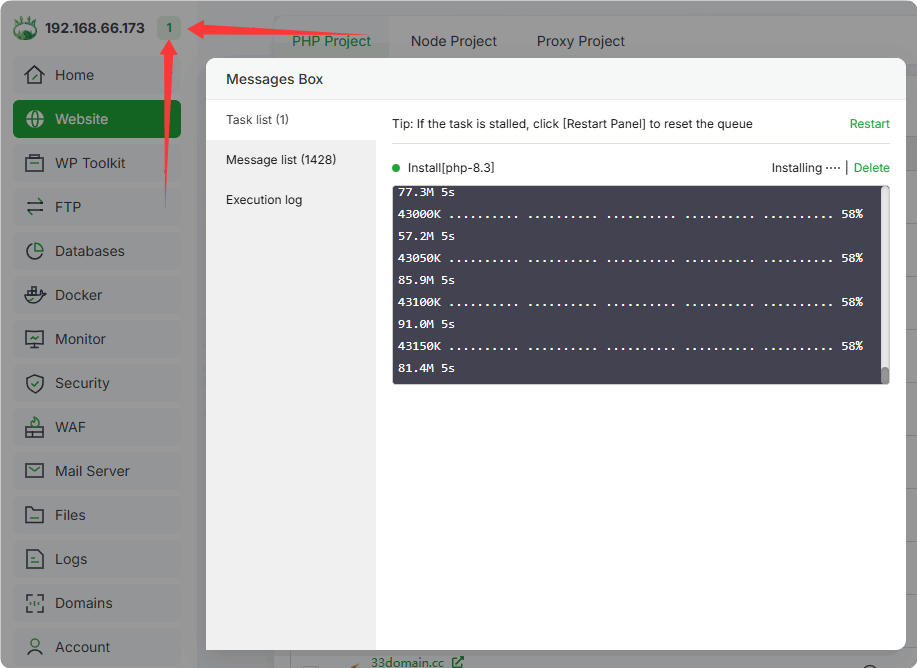
Message box
Displays the progress of software
installationandupgrade.
Task list : Display the installation process of software installation and upgrade in real-time.
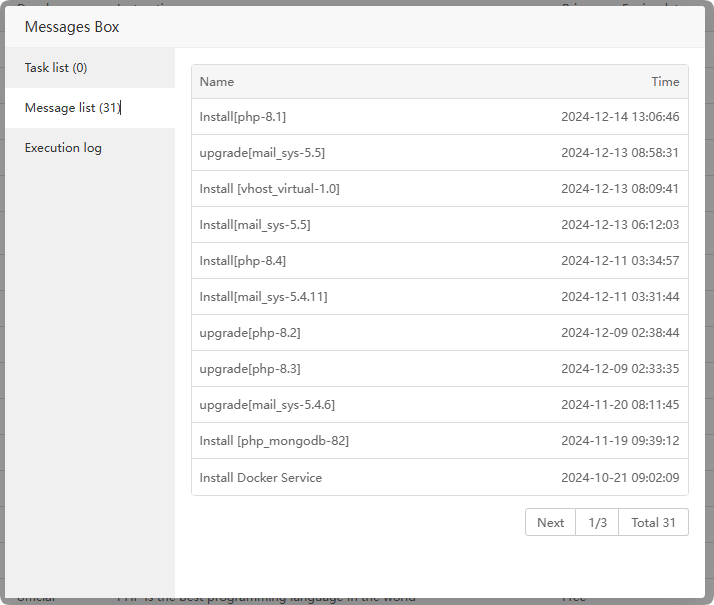
Message list : Record software installation and upgrade operation logs.
Execution log : Check the software installation execution log. If any
software installation fails, can check here.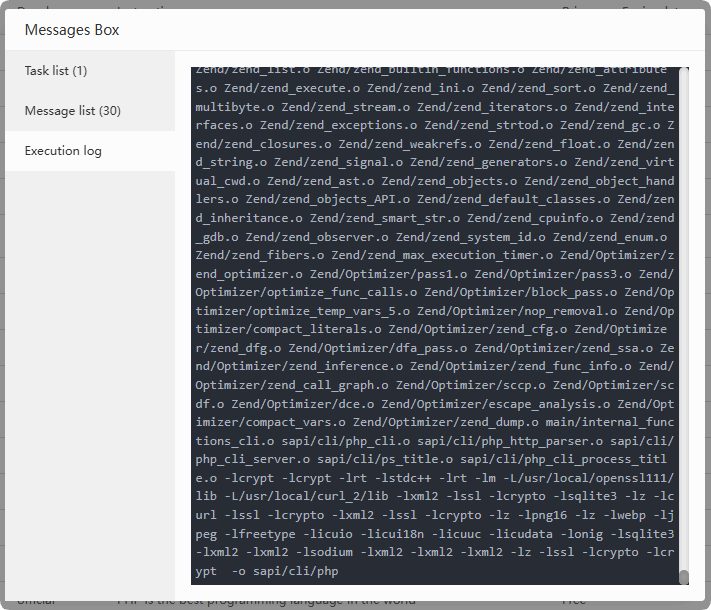
To view more installation logs, please view the /tmp/panelExec.log file
Feedback or Suggestions
If you encounter problems or suggestions during use, please contact us through the following methods:
- (Please describe in
detailor providescreenshots)
Email: [email protected]
Discord: https://discord.gg/Tya5yceBpd
Telegram: https://aapanel.com/tg
GitHub: https://github.com/aapanel/aapanel
If you like aaPanel, please give it a Star