
Website Analytics User Guide
Overview
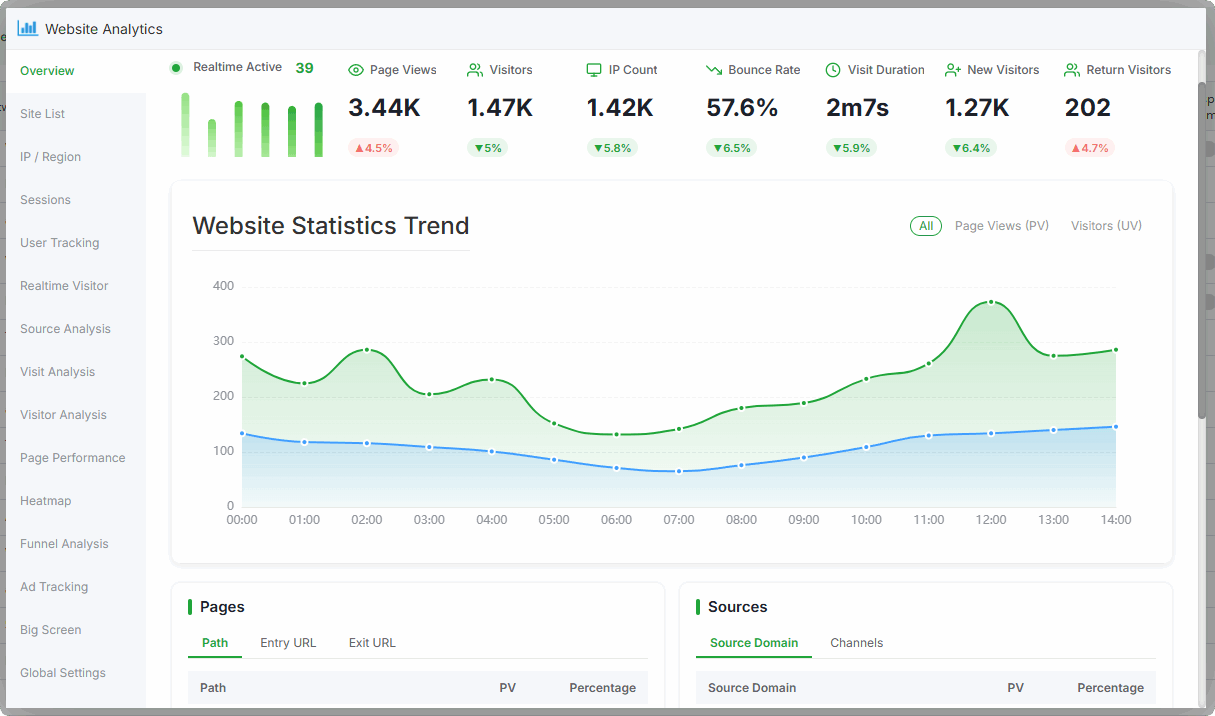
Website Analytics is a lightweight, self-hosted website traffic analytics system. Its core advantages:
Self-hosted: All data is stored on your own server and never passes through third-party platforms — full control over data security.
High performance: Built on a Go-based collector with a DuckDB columnar storage engine, a single instance can sustain millions of page views (PV) per day.
Low footprint: No MySQL/PostgreSQL dependency. The embedded database works out of the box.
Accurate and reliable: Distinguishes new vs. returning visitors reliably; behaviour is identical with and without cookies (including incognito), and it is GDPR-compliant.
Comparison
| Criterion | Website Analytics | Website statistics-v2 | Google GA |
|---|---|---|---|
| Collection method | Front-end JS (cookie-less) | Server log parsing | Front-end JS |
| Deployment model | Self-hosted (private) | Self-hosted (private) | SaaS / cloud |
| Database | DuckDB embedded (columnar) | SQLite embedded | Cloud |
| Web Vitals metrics | ✅ | ❌ No front-end performance | ✅ |
| Session replay | ✅ | ❌ | ❌ (No native support; requires Clarity/Hotjar or similar) |
| Conversion funnel | ✅ | ❌ | ✅ |
| Heatmap | ✅ | ❌ | ❌ (No native support; requires Clarity/Hotjar or similar) |
| Spider / crawler stats | ❌ Crawlers not collected | ✅ Strong at distinguishing real vs. fake spiders | ❌ Crawlers not collected |
| UTM / campaign tracking | ✅ | ❌ | ✅ Google Ads |
| Privacy compliance | ✅ Anonymous identity hashing, GDPR-friendly | Log-based IP retention | Data uploaded to Google |
| Multi-site management | ✅ | ✅ | ✅ |
| Pricing | Included in PRO or standalone plugin | Included in PRO or standalone plugin | Free tier; advanced features paid |
| Use case | Private deployment, site operations | Private deployment, DevOps | Site operations |
Feature Matrix
| Feature | Description |
|---|---|
| Overview | Core metrics such as PV, UV, IP, bounce rate, average visit duration and active-user trends |
| IP / Region | Visual geographic distribution of visitor IPs at country / province level |
| Sessions | Visit-granular paged session list; multiple visits by the same visitor appear as separate rows, each with detail and behaviour trail |
| User Tracking | Ranking of page-view paths and analysis of page-transition event flows |
| Realtime Visitor | Real-time list of online visitors with live navigation trails |
| Source Analysis | Referrer domains and channel breakdown: direct, search engines, social platforms, external links, paid campaigns and UTM-parameter channels |
| Visit Analysis | Ranking of site entry pages and exit pages |
| Visitor Analysis | Visitor distribution across six dimensions: geography, browser, OS, device, screen size and language |
| Page Performance | Core Web Vitals (LCP, INP, CLS, FCP, TTFB) with averages, scores, trends and dimension breakdowns |
| Heatmap | Visual click-coordinate heat distribution per page, with per-page independent configuration and data queries |
| Funnel Analysis | Custom conversion step sequences with per-step visitor counts and drop-off rates to locate bottleneck steps and optimise the conversion path |
| Ad Tracking | UTM five-parameter tracking (source, medium, campaign, content, term) plus Click-ID tracking for major ad platforms |
| Big Screen | Full-screen visualisation of core metrics and IP geo-distribution with a dedicated URL, per-user access control and screen-casting support |
Quick Start
Requirements
| Item | Requirement |
|---|---|
| Server | Linux on x86_64 / Arm architecture |
| Memory | 1 GB minimum; 2 GB or more recommended |
| Disk | ~200 MB base footprint; a site with ~10 K PV/day adds ~100 MB/month (replay disabled) |
| Web server | Nginx (automatic / manual), Apache (manual only), or multiple web servers |
Installing the Plugin
Log in to aaPanel, go to App Store, search for Website Analytics, and install the plugin with one click. After installation, open the plugin's settings page to start using it.
Enabling Site Statistics
In the plugin's Sites list, add the sites you want to track and enable statistics in either automatic or manual mode. If a site is behind a CDN, configure the corresponding provider settings so the real visitor IP can be resolved.
| Setting | Description |
|---|---|
| CDN Client IP | Supports Cloudflare, Alibaba Cloud and Tencent Cloud; adapts to the matching CDN environment for accurate IP statistics. Can be skipped if the panel-level CDN setting is already enabled |
| Store IPs | Disabled by default (IPs are not persisted; used only for geo-resolution and identity recognition). Once enabled, only newly collected data for that site will store IPs |
| Session Replay | When enabled, the site records user sessions according to the configured sample rate. Note that replay consumes significant storage, so enable it based on your needs |
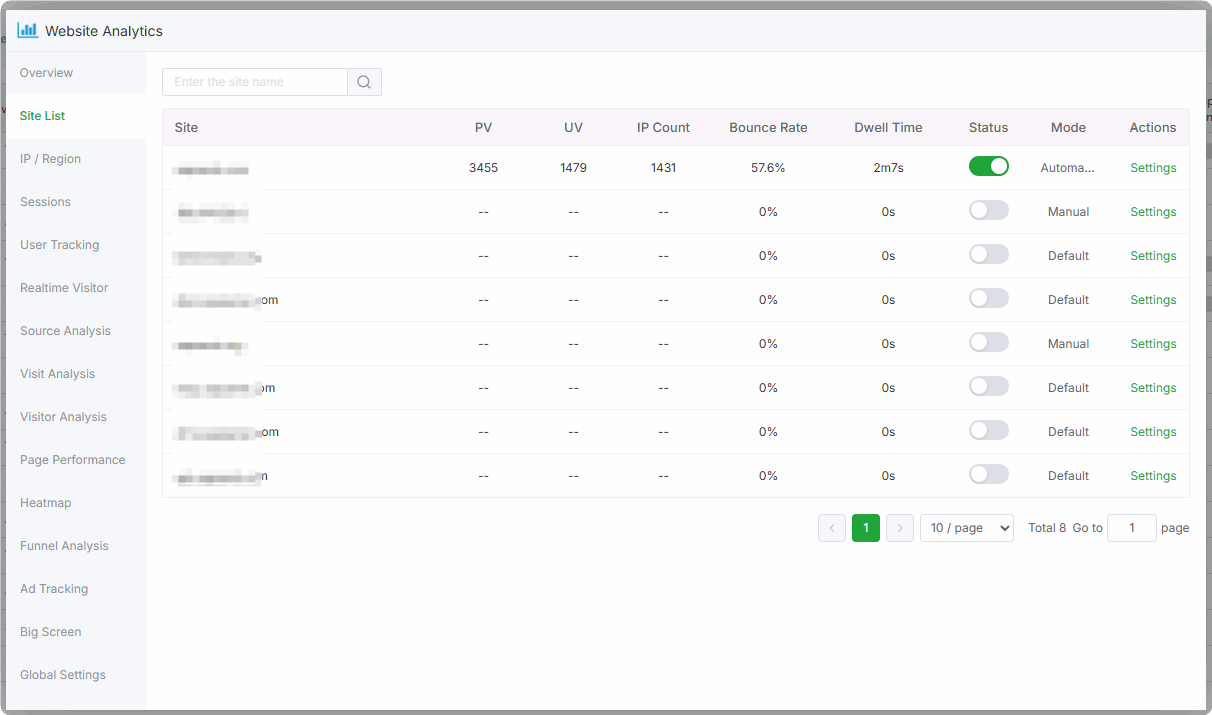
Note: After enabling statistics, purge the CDN cache or add the following paths to the CDN cache whitelist so the tracking scripts are always delivered:
/bt-stats.js
/bt-stats.gif
/bt-replay.js
/bt-replay-config
/bt-stats-replay
Deploying the Tracking Script
Automatic deployment is preferred. Switch to manual deployment in the following cases: the web server is Apache, the site already sits behind a reverse proxy, or automatic injection fails.
Automatic deployment: the plugin rewrites the site's Nginx configuration and injects the tracking script itself. No site-code changes are needed — collection and reporting begin as soon as statistics are enabled.
Manual deployment
For Apache, reverse-proxy, or failed-automatic-deployment scenarios. After statistics are enabled manually, the plugin first writes the collector-endpoint forwarding config, then complete the three steps below:
① Get the script: the plugin generates a snippet containing the site's unique website_id. In normal use, simply copy the snippet provided by the plugin — no replacement is required.
② Choose a placement (pick one): both methods use the same snippet; configure either of them.
- Method A — Nginx: add a
sub_filterrule inside the site's server block to insert the snippet before</head>:
sub_filter '</head>' '<script defer src="/bt-stats.js?site={website_id}&version1"></script><script defer src="/bt-replay.js?site={website_id}"></script></head>';- Method B — Page code (recommended): paste the snippet before the
</head>tag on every page of the site. For multi-page sites, put it in a shared template (e.g.header.htm) so a single edit applies site-wide:
<script defer src="/bt-stats.js?site={website_id}&version1"></script>
<script defer src="/bt-replay.js?site={website_id}"></script>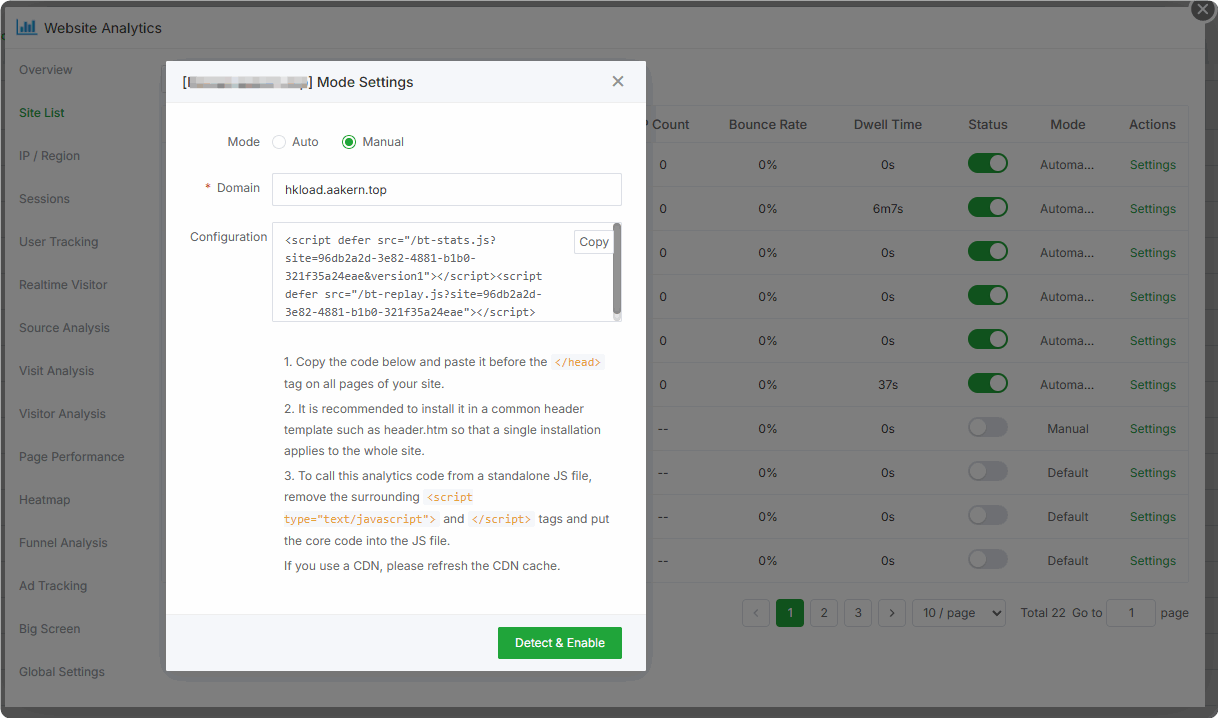
③ Verify: return to the plugin and click Verify. The plugin fetches the site homepage and checks whether the bt-stats.js snippet is live; you can also confirm it yourself via the deployment self-check below. Once verification passes, statistics for the site go live.
Notes & compatibility
Embedding in a standalone JS file: to load the tracker from your own JavaScript bundle, drop the outer <script> wrapper and inject the scripts dynamically instead. If the site uses a CDN, purge the CDN cache after the change.
Reverse proxy: automatic deployment aborts when a reverse proxy is detected on the site. Add the following directive inside the relevant proxy_pass block and retry, or use the manual method above:
proxy_set_header Accept-Encoding "";Core endpoints (for troubleshooting)
| Endpoint | Purpose |
|---|---|
/bt-stats.js | Serves the site tracking script |
/bt-stats.gif | Receives and reports visitor statistics |
Deployment self-check (optional; applies to automatic and manual alike)
Open any page of the target site.
Open the browser developer tools and switch to the Network tab.
Look for a
bt-stats.gifrequest: a 200 status with a 1×1 transparent GIF response means the collector is working.Wait a few seconds, then return to the plugin's overview page and confirm that statistics are being generated.
Metrics Reference
Core Traffic Metrics
| Metric | Formula | Description |
|---|---|---|
| PV | Total page-view events | Total number of page views |
| UV | Unique visitors (deduplicated by anonymous identity) | Approximated as "same IP + same browser + same month ≈ same visitor"; the identity rotates monthly, so visitors cannot be correlated across months |
| IP | Unique IPs: counted via COUNT(DISTINCT ip) after the site enables “Store IPs”; shows 0 by default | IPs are not collected by default. Enable “Store IPs” in Sites → site settings if you need true unique-IP data (applies only to newly collected data) |
| Bounce rate | Single-page visits / total visits | A visit is delimited by a 30-minute inactivity window; the share of visits that left after a single page |
| Avg. duration | Total dwell time / total visits | Average dwell time per visit, capped at 30 minutes to filter out anomalous data |
Percentile Benchmarks
| Metric | Definition | Focus | Use case |
|---|---|---|---|
| P50 | Median | Middle of the data | Baseline for typical traffic and performance |
| P75 | 75th percentile | Upper bound of 75% of data | Diagnosing poor experience for the majority |
| P95 | 95th percentile | Upper bound of 95% of data | Hunting long-tail anomalies and slow requests |
Web Vitals Score Thresholds
| Metric | Definition | Good | Needs improvement | Poor | Bad |
|---|---|---|---|---|---|
| LCP (Largest Contentful Paint) | When the largest content element finishes loading | ≤ 1.5 s | ≤ 2.5 s | ≤ 4 s | > 4 s |
| INP (Interaction to Next Paint) | Interaction response latency | ≤ 100 ms | ≤ 200 ms | ≤ 500 ms | > 500 ms |
| CLS (Cumulative Layout Shift) | Layout shift during load | ≤ 0.05 | ≤ 0.1 | ≤ 0.25 | > 0.25 |
| FCP (First Contentful Paint) | Time to first content render | ≤ 1 s | ≤ 1.8 s | ≤ 3 s | > 3 s |
| TTFB (Time to First Byte) | Time until the first byte from the server | ≤ 400 ms | ≤ 800 ms | ≤ 1.8 s | > 1.8 s |
Feature Reference
Heatmap
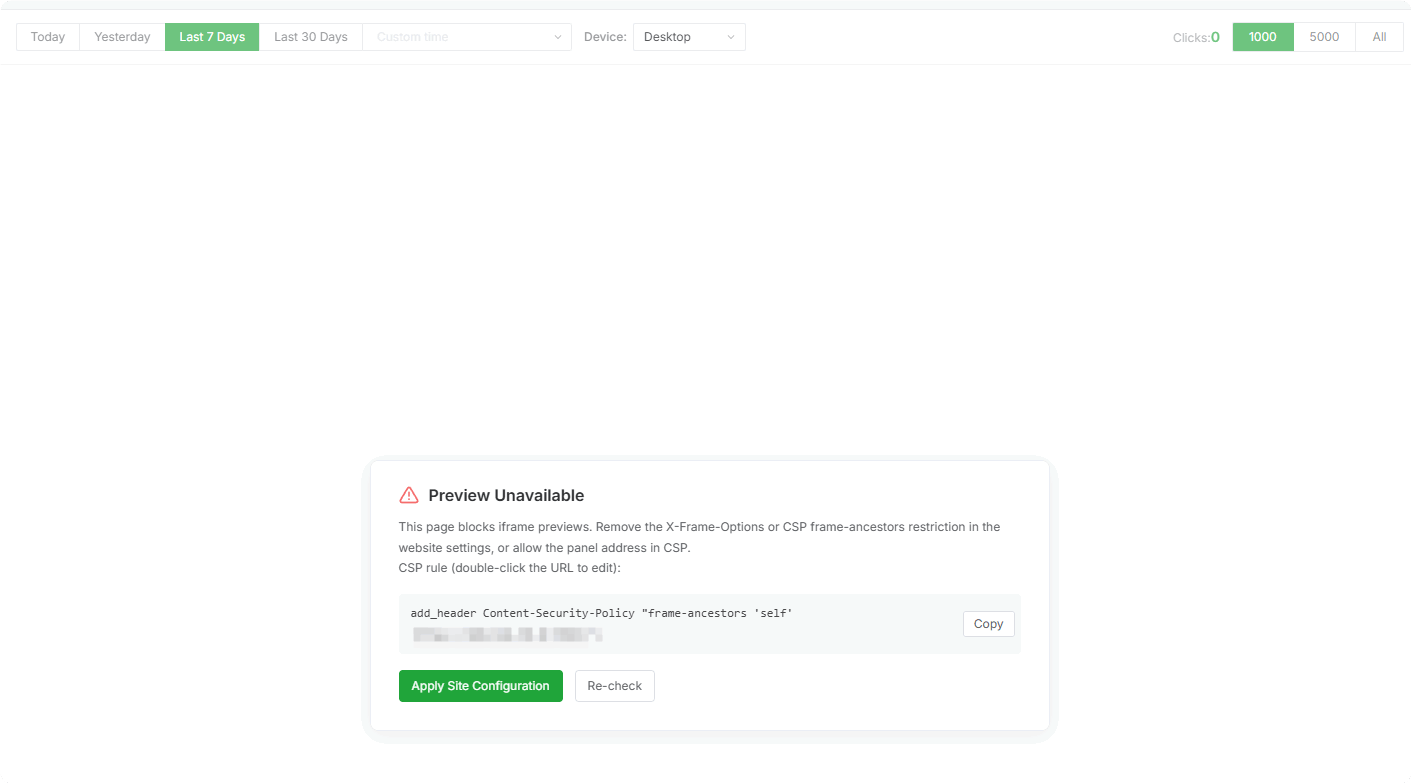
The heatmap visualises where visitors click on a page, making it easy to spot high-traffic zones and the content users focus on. Use it to evaluate page layout, the exposure of buttons and ad placements, and to refine interaction design for better conversion.
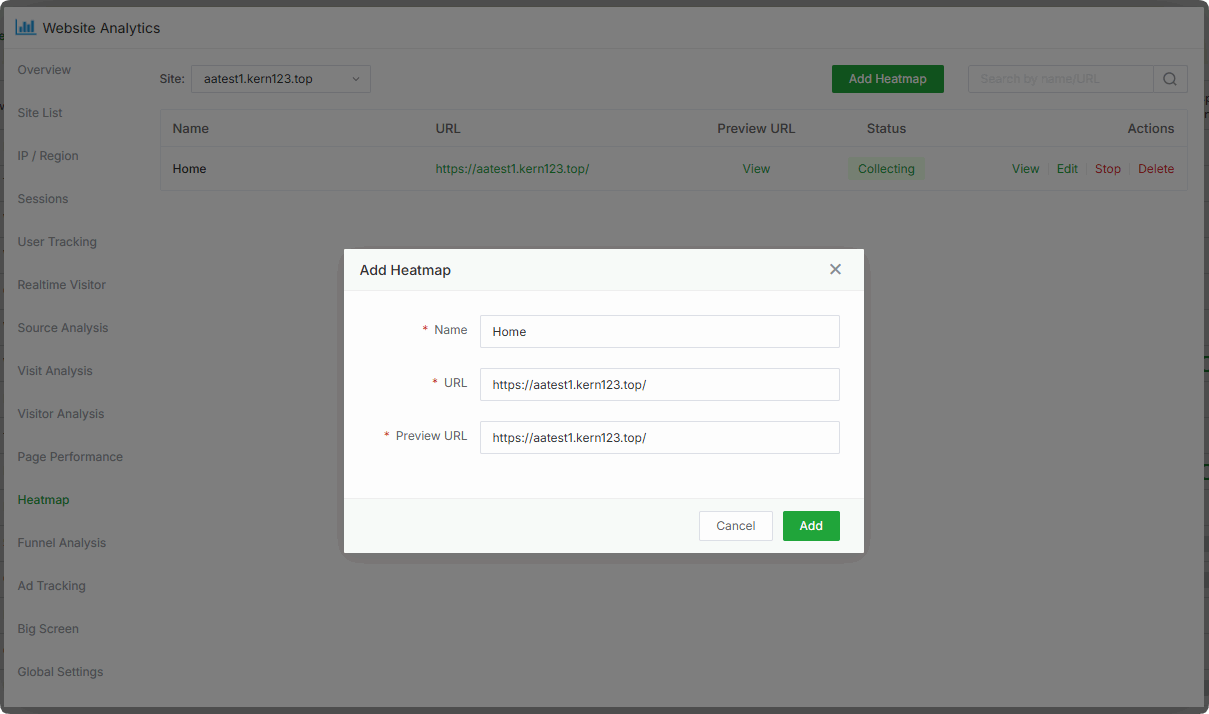
How to use: on the Heatmap page, add the URL of the page to monitor and save it to generate a click-heat distribution. Data can be filtered by device type (desktop / tablet / mobile) to compare heat across viewports for multi-device optimisation.
Compatibility notes:
- Heatmap preview relies on iframe-embedding the target page. If the site sends
X-Frame-Options: SAMEORIGINor a CSPframe-ancestorsrestriction, remove it or allow the panel domain/IP, or the preview will not load. - If one-click injection into the site config fails, add the CSP allowance manually to the site's Nginx/Apache config, substituting the real panel domain or IP for
frame-ancestors.
Conversion Funnel
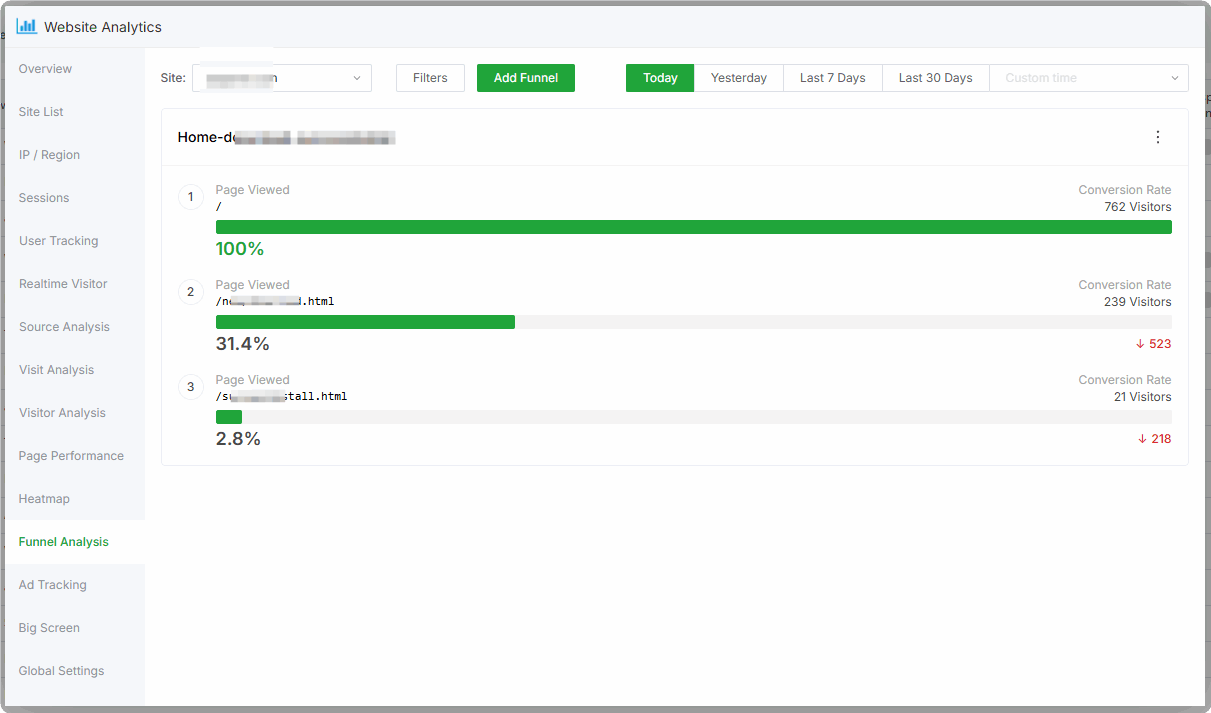
The funnel lets you define custom conversion steps and reports the visitor count and drop-off rate at each step, showing the full path from entry to goal completion so you can pinpoint where users leave and optimise those pages or flows.
Example: a three-step conversion — homepage (index.html) → download page (download.html) → installation success page (/successinstall.html). The funnel displays entrants, drop-offs and the step conversion rate per node, so the weakest step is obvious and can be prioritised.
Session Replay
Session replay reconstructs a visitor's real browsing session — mouse movement, clicks, scrolling and page navigation — as a video, giving a direct view of the user's path. Without extra instrumentation you can diagnose sluggish pages, unresponsive buttons and broken flows, understand why users drop off, and improve interaction design.
Enabling replay: after statistics are enabled for a site, turn on the replay switch in Sites → site settings, optionally adjusting the sample rate and path filters, to begin capturing replay data.
Replay settings:
| Setting | Description |
|---|---|
| Replay switch | Enable / disable replay capture for the site |
| Sample rate | A decimal in (0,1] controlling the share of visitors recorded, e.g. 0.1 records 10%, 0.5 records 50%. Lower it according to traffic volume and storage before enabling |
| Path filter | Page paths to exclude from recording (substring match; pages that match are not recorded), e.g. /login, /admin/. Filtering login and payment pages is recommended |
Replay request flow:
| Request | Description |
|---|---|
/bt-replay.js | Serves the replay recorder script; after load it requests the config and decides whether to record |
/bt-replay-config | Returns replay config: sample=1 starts recording, sample=0 means not started or not sampled; recordingId is the recording-instance ID |
/bt-stats-replay | Uploads replay data blocks. HTTP 204 is a valid upload; a 200 indicates the upload was blocked and the data is rejected as invalid |
Example replay-config response:
{
    "sample": 0,
    "blockUrls": null,
    "recordingId": "80c8e723-888b-4c56-b5e2-34fed4460430",
    "maxDuration": 30,
    "maskLevel": "moderate",
    "sessionId": "1f9f8d4c-..."
}| Field | Description |
|---|---|
| sample | 1 start recording / 0 not sampled |
| blockUrls | Page paths to exclude (substring match; matching pages do not start recording) |
| recordingId | Recording-instance ID for this page load |
| maxDuration | Per-recording timeout in minutes; recording stops automatically when reached (default 30) |
| maskLevel | Masking level: moderate / strict |
| sessionId | Anonymous session identifier (server-issued without cookies; shared with the stats channel) |
Privacy protection: replay enables input masking by default (moderate) — input fields, passwords, emails, phone numbers and other form content are masked and never enter the recorded data. A site may be set to strict, in which case visible page text is also masked for stronger visitor privacy.
Compatibility notes:
- Sites with statistics enabled automatically: enabling replay injects the required config automatically — no manual action needed.
- Sites enabled manually: update the
</head>config on every page to include the replay script so replay can work.
Live Dashboard
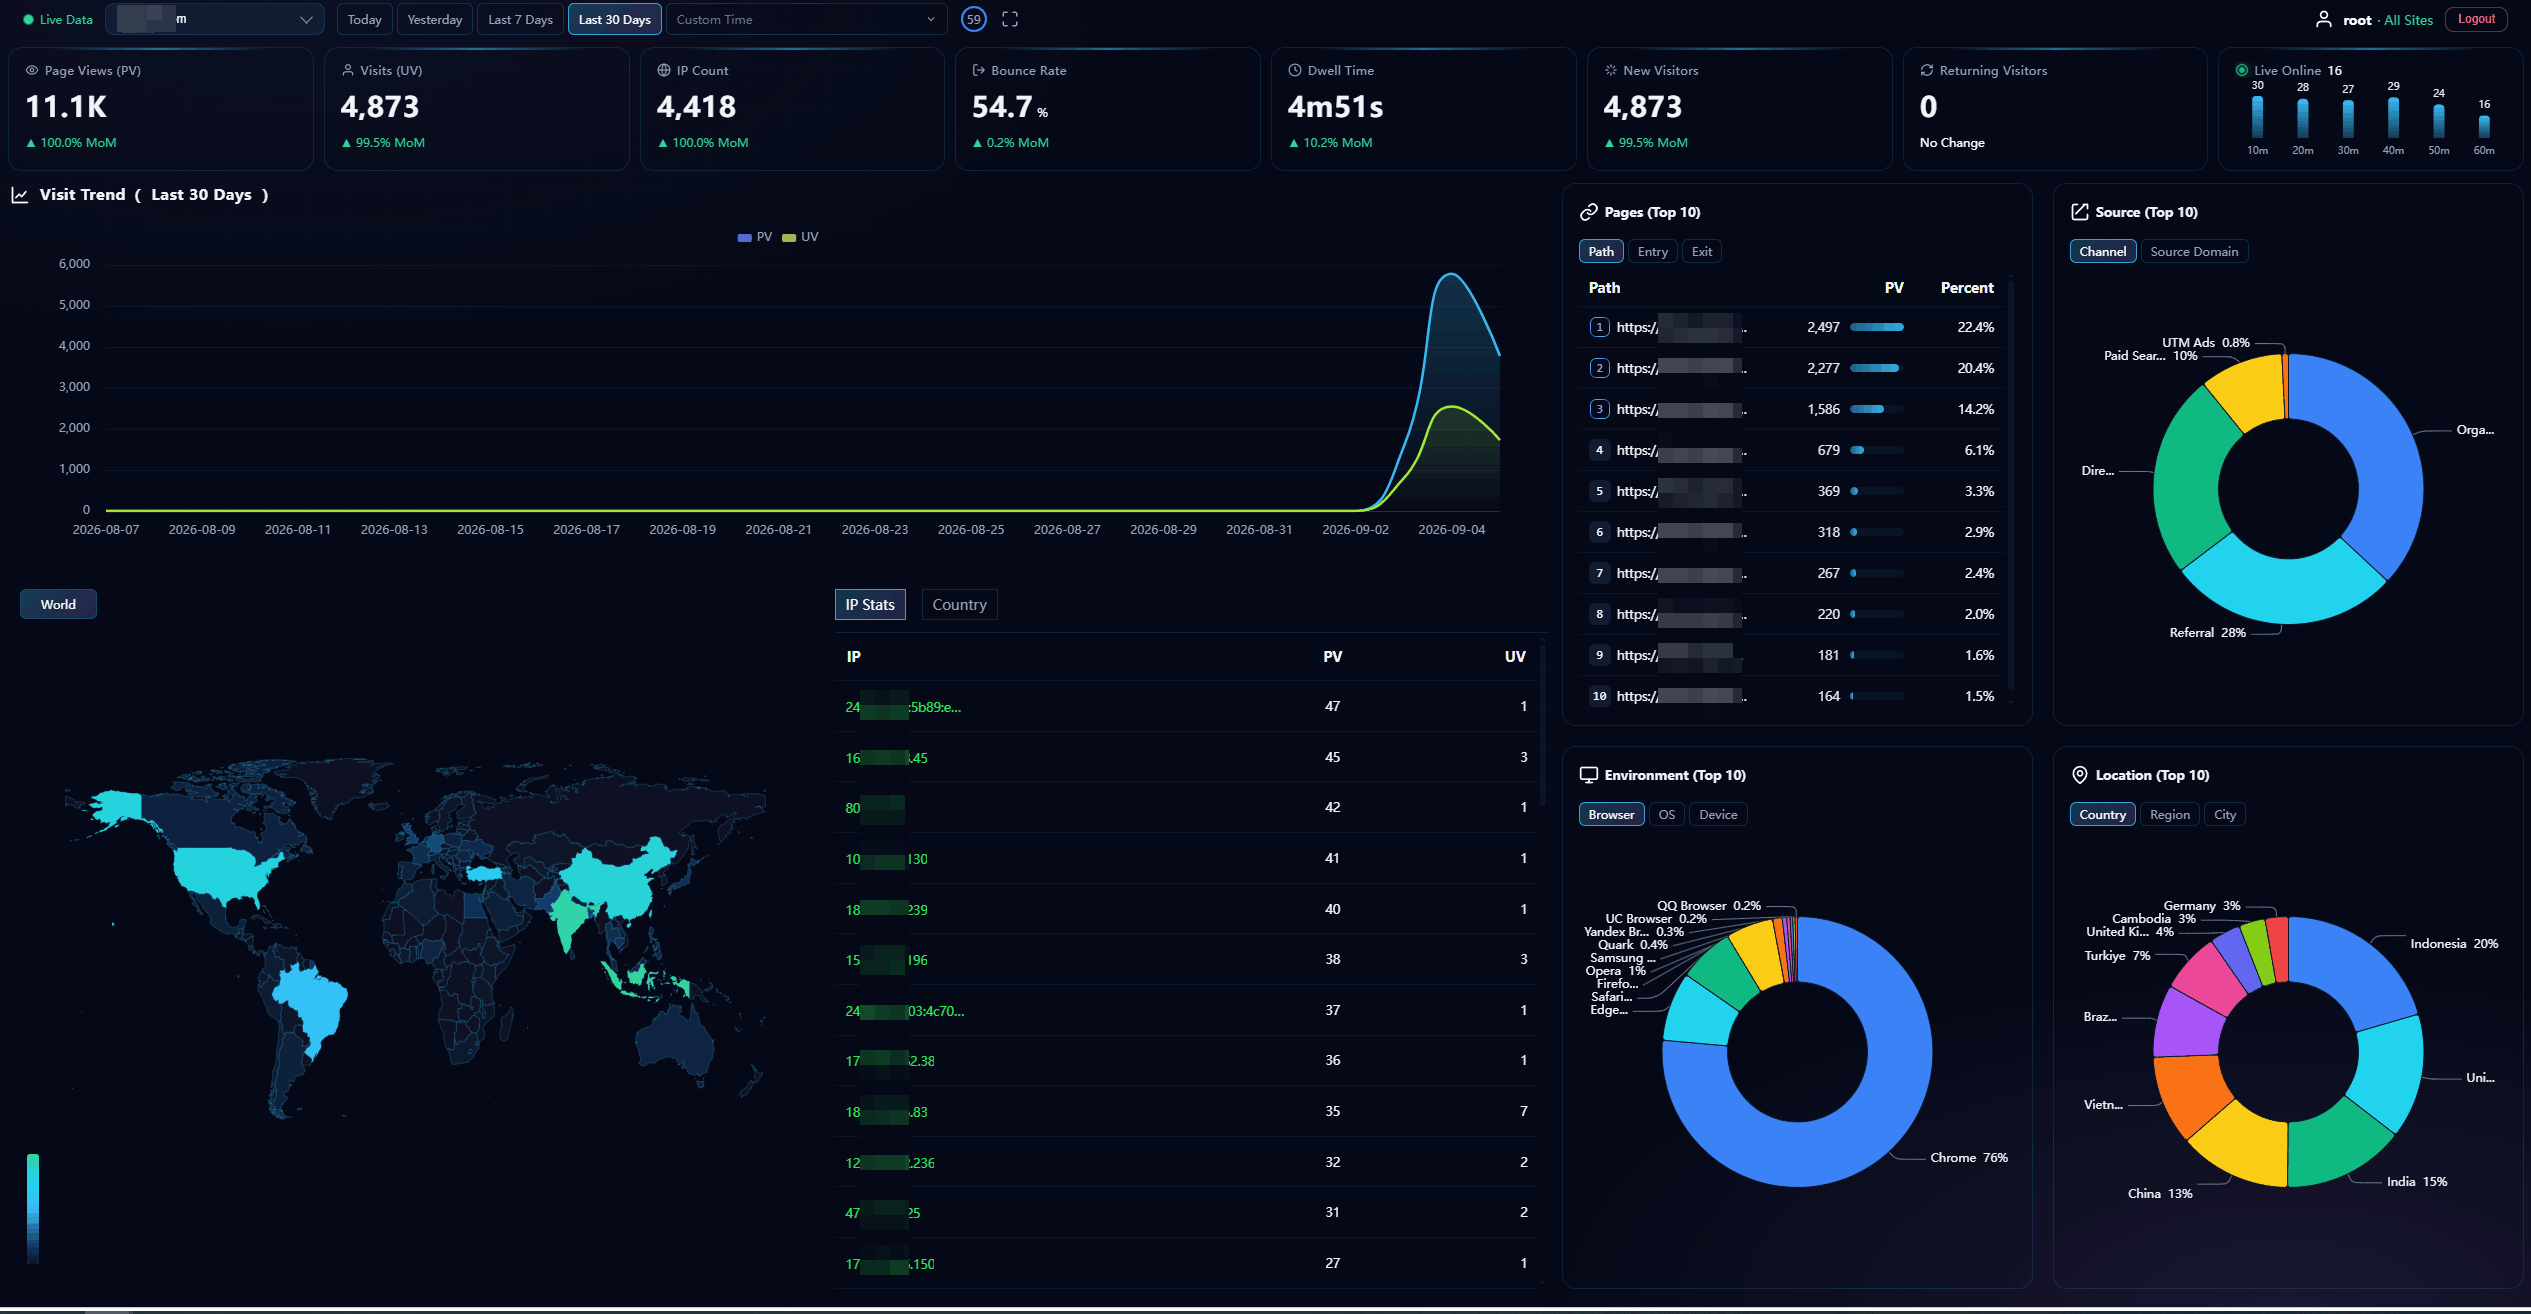
The live dashboard is an immersive full-screen view aggregating core traffic metrics and IP geo-distribution. It supports a dedicated URL and per-user access control, making it suitable for operations reviews or NOC displays on large screens.
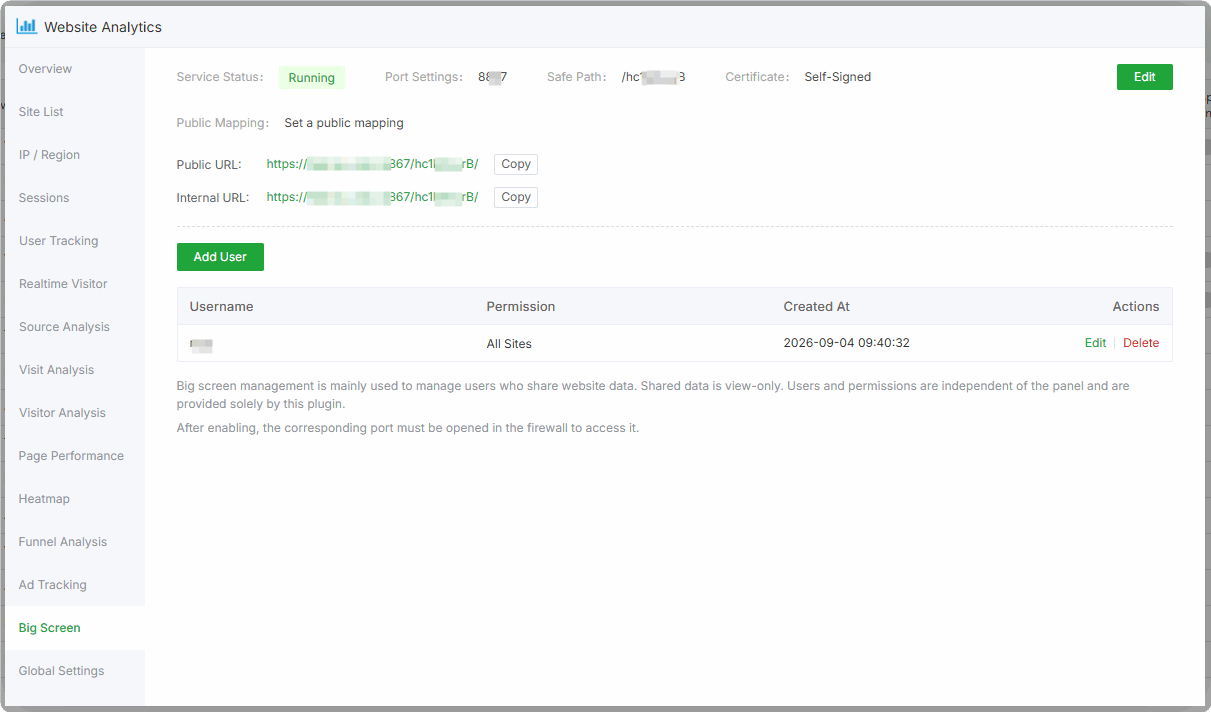
How to use: under the plugin's Dashboard settings, enable the dashboard, configure the access port, safe path or domain, then add dashboard users and their site authorisations. Open the generated URL on a large-screen device for full-screen display.
Global Settings
Beyond per-site configuration, the plugin provides global collection controls and data maintenance, all managed from the plugin's settings page.
Global Exclusion Rules
Rules below are global; matching traffic is not collected. They are commonly used to keep admin, testing and crawler traffic from polluting your statistics:
| Setting | Description | Format |
|---|---|---|
| Excluded IPs | Visitors whose IP (or IP range) match are not reported (defaults include 127.0.0.1) | 192.168.1.1 or 192.168.1.1-192.168.1.10, one per line |
| Excluded domains | Requests whose Host matches are not reported | test.example.com |
| Excluded URLs | Page requests matching the path are not reported; wildcards supported | /favicon.ico, /admin/* |
Real Visitor IP (CDN / Proxy)
The collector reads the real visitor IP from the X-Real-IP header by default. Behind a CDN or reverse proxy, if unique-IP or geo statistics look wrong, enable a custom header in the global settings and enter the header that actually carries the real client IP (e.g. Cloudflare's CF-Connecting-IP, or the equivalent source-return header used by Alibaba Cloud / Tencent Cloud CDN). Sites already covered by the panel-level CDN setting need no per-site override.
Data Retention & Cleanup
| Operation | Description |
|---|---|
| Retention period | Statistics are purged automatically by retention days (default 365, minimum 7); cleanup includes DuckDB log compaction / WAL recycling. Adjustable in settings |
| Manual cleanup | Purge data older than N days, or clear everything at once, to free disk space quickly |
| Site data | After a site is deleted in the panel, its residual statistics and config can be removed from the plugin in one step |
FAQ
1. Why are statistics lower than the actual traffic?
The tracking script does not cover every page, so some pages report no data.
Ad blockers or browser extensions block the tracking script.
The backend filters out invalid/illegitimate reports automatically.
A misconfigured CDN IP resolution distorts unique-IP and visitor statistics.
2. Browser compatibility
Fully compatible with mainstream modern browsers (Chrome, Firefox, Safari, Edge, etc.). Web Vitals metrics are only collected in browsers that support the PerformanceObserver API.
3. Data storage lifetime
The plugin stores data in DuckDB with columnar compression — a site at ~10 K PV/day adds only ~100 MB per month. Data is purged automatically according to the retention period (adjustable in plugin settings; cleanup includes log compaction / WAL recycling). Increase the retention period if you need long-term storage.
4. Multi-site support
Multiple sites are supported at once. Each site's data is fully independent; deploy the tracking script per site to collect per-site statistics.
5. User privacy handling
Cookie-less by design: no cookies are written or read, so behaviour is consistent when cookies are disabled or in incognito windows.
Visitors are identified by a server-side deterministic anonymous hash (no personally identifiable information is collected). The identity rotates monthly, so data cannot be correlated to an individual across months.
IPs are not persisted by default: they are used only for geo-resolution and identity hashing. If retention is required, the site owner enables the “Store IPs” toggle per site.
Privacy signals such as browser GPC, DNT and
data-do-not-trackare respected — collection stops for visitors that signal opt-out.All statistics stay on your own server and are never uploaded to any third party.